I had long believed that 115% maybe 120% was the upper limit for volumetric efficiency (VE) for naturally aspirated engines. Then I see a claim of 137% on Larry Widmer's website (see below). Am I way behind the times? Can someone enlighten me on this claim? I can't find any further reference on the Endyne website.
Endyne Home Page

Volumetric efficiency.
Started by
gruntguru
, May 16 2009 08:01
32 replies to this topic
Advertisement
#2

Tony Matthews
-

- 17,519 posts
- Joined: September 08
Member
Posted 16 May 2009 - 08:31
I thought the Endyne site was very disappointing, with not a lot of info on anything other than grandiose claims! I may be being unfair...
#3
gruntguru
-
- 7,642 posts
- Joined: January 09
Member
Posted 16 May 2009 - 23:23
I got the same impression hence my question.I thought the Endyne site was very disappointing, with not a lot of info on anything other than grandiose claims! I may be being unfair...
Does anyone know what is the current state of the art for VE? Some of the calcs I have attempted for F1 engines are suggesting VE higher than 115% (if the power claims are real).
#4
Joe Bosworth
-

- 687 posts
- Joined: May 05
Member
Posted 17 May 2009 - 14:18
Grunt
As you know I have posted in other threads some data on the total efficiency of the very best engines for which there is even close to good data regarding displacement, HP and RPM. I use the total air that could be ingested at 100% VE vs the LHV of fuel that air would burn and compare to quoted HP.
Of course really good engines get VE over 100% at peak HP but my calcs on many many engines show a net efficiency stopping at about 45%. That is 55% losses to all things including heat and friction and etc. When the VE goes over 100% the losses to heat and friction then would calculate to a bigger % figure accordingly.
Any way, to make a long story short, to think in terms of VE over about 115% one would then get losses of heat and friction that are extra ordinarily high. Playing with values with some good estimates of VE it is hard to estimate heat and friction losses greater than about 60%.
If that is the case then we can put a reasonable ceiling on VE claims. The reaity is that very few people other than the super professional dyno operations ever try to measure VE, heat and friction losses and they don't talk much let alone publish. In years far past I ran some full analysis that pretty much concur with the above.
It may be that the VE claims of 115% are even stretching reality a bit. The real problem is that as one gets to very high VE the RPM spread between max T and Max HP narrows. (I once built an engine where these RPMs coincided and it was a pig.)
We get to see the RPM range of F1, NASCAR and Moto GP and they are quite wide ranged.
F1 regularly is seen using usefully between 10K and 17K while Moto GP is seen between 8K and 17K. We see NASCAR running as low as 5K with topping out at close to 8.5 or a bit more. If anyone thinks they are building engines more efficient than these three categories I really worry.
Regards
#5
J. Edlund
-

- 1,323 posts
- Joined: September 03
Member
Posted 17 May 2009 - 20:25
Also remember that there are two types of volumetric efficiencies. We have the volumetric efficiency as based on air consumption divided by engine speed and displacement, and we have the previous multiplied with the 'trapping ratio', that is how much air is actually used for combustion. The latter tend to be slightly lower than the previous, and with two stroke engines it can be significantly less.
+130% efficiencies shouldn't be impossible for the first type of volumetric efficiency.
+130% efficiencies shouldn't be impossible for the first type of volumetric efficiency.
#6
gruntguru
-
- 7,642 posts
- Joined: January 09
Member
Posted 17 May 2009 - 23:10
I think most people quoting VE use the former. For estimating thermal efficiency and testing the plausibility of power claims of course you need to use the latter.Also remember that there are two types of volumetric efficiencies. We have the volumetric efficiency as based on air consumption divided by engine speed and displacement, and we have the previous multiplied with the 'trapping ratio', that is how much air is actually used for combustion. The latter tend to be slightly lower than the previous, and with two stroke engines it can be significantly less.
+130% efficiencies shouldn't be impossible for the first type of volumetric efficiency.
#7
gruntguru
-
- 7,642 posts
- Joined: January 09
Member
Posted 18 May 2009 - 00:07
Do you mean 45% maximum?Of course really good engines get VE over 100% at peak HP but my calcs on many many engines show a net efficiency stopping at about 45%.
I don't think 60% losses would be unusual, especially at ultra high (17k) RPM.That is 55% losses to all things including heat and friction and etc. When the VE goes over 100% the losses to heat and friction then would calculate to a bigger % figure accordingly.
I think J. Edlund's point about trapping ratio is crucial. For the type of analysis you are talking about we need to use the effective VE which is lower than the measured VE.Any way, to make a long story short, to think in terms of VE over about 115% one would then get losses of heat and friction that are extra ordinarily high. Playing with values with some good estimates of VE it is hard to estimate heat and friction losses greater than about 60%.
Really? Surely peak VE occurs at or slightly above peak torque?If that is the case then we can put a reasonable ceiling on VE claims. The reaity is that very few people other than the super professional dyno operations ever try to measure VE, heat and friction losses and they don't talk much let alone publish. In years far past I ran some full analysis that pretty much concur with the above.
It may be that the VE claims of 115% are even stretching reality a bit. The real problem is that as one gets to very high VE the RPM spread between max T and Max HP narrows. (I once built an engine where these RPMs coincided and it was a pig.)
Agreed.We get to see the RPM range of F1, NASCAR and Moto GP and they are quite wide ranged.
F1 regularly is seen using usefully between 10K and 17K while Moto GP is seen between 8K and 17K. We see NASCAR running as low as 5K with topping out at close to 8.5 or a bit more. If anyone thinks they are building engines more efficient than these three categories I really worry.
Edited by gruntguru, 18 May 2009 - 00:07.
#8
Joe Bosworth
-
- 687 posts
- Joined: May 05
Member
Posted 18 May 2009 - 02:36
Grunt
Yes 45% max
I am talking Edlund's second definition of VE and hope you are as well but please let us know so we can sing out of the same hymn book.
Regards
#9
gruntguru
-
- 7,642 posts
- Joined: January 09
Member
Posted 18 May 2009 - 07:05
Yes the second is the only one useful for analysing performance and TE, but the first is more frequently quoted because it is easier to measure (and its a more impressive number.)I am talking Edlund's second definition of VE and hope you are as well but please let us know so we can sing out of the same hymn book.
#10
imaginesix
-

- 7,525 posts
- Joined: March 01
Member
Posted 19 May 2009 - 16:42
How much lower is "slighly lower"? If the first V.E. is 100% would the second typically be 98%? 80%? (For a four stroke).Also remember that there are two types of volumetric efficiencies. We have the volumetric efficiency as based on air consumption divided by engine speed and displacement, and we have the previous multiplied with the 'trapping ratio', that is how much air is actually used for combustion. The latter tend to be slightly lower than the previous, and with two stroke engines it can be significantly less.
+130% efficiencies shouldn't be impossible for the first type of volumetric efficiency.
Reason I ask is that this guy http://forums.autosp...w...t&p=3173522 is claiming 325+ N.A. hp from 2.0L with a 8300 rpm cutoff. Maybe they don't rate them by SAE hp in Argentina?
Edited by imaginesix, 19 May 2009 - 16:43.
#11
J. Edlund
-
- 1,323 posts
- Joined: September 03
Member
Posted 19 May 2009 - 18:40
How much lower is "slighly lower"? If the first V.E. is 100% would the second typically be 98%? 80%? (For a four stroke).
Reason I ask is that this guy http://forums.autosp...w...t&p=3173522 is claiming 325+ N.A. hp from 2.0L with a 8300 rpm cutoff. Maybe they don't rate them by SAE hp in Argentina?
The trapping ratio is usually between 0.9 and 1.0, the figures below is based on simulations of a BMW M3 engine (with some slight adjustments)
ES: 999.998 2000.0 3000.0 3250.0 3999.99 5000.01 6000.01 7000.04 7400.03 7900.22
VE: 0.617291 0.994374 1.00982 0.823533 1.16024 1.08555 1.24271 1.17616 1.1847 1.1414
TR: 0.999785 0.904249 0.932814 0.999999 0.926641 0.99303 0.936554 0.986594 0.959831 0.955141
VE: 0.617158 0.899162 0.941978 0.823532 1.07513 1.07798 1.16386 1.16039 1.13711 1.0902
During the late nineties I believe the final versions of Volvos BTCC engine developed 326 hp (running something like 17 mm valve lift), and I believe Opel/Vauxhall even had an engine with slightly more than 330 hp. Maximum speed was 8500 rpm, so power outputs in that class are certainly not impossible from a 2 litre engine running to 8300 rpm, they are however very difficult to reach as you need both a very high volumetric efficiency and very low frictional losses.
#12
imaginesix
-
- 7,525 posts
- Joined: March 01
Member
Posted 19 May 2009 - 21:30
Interesting data, but I need to understand more
In particular, how can the engine draw more air than is used for combustion if there is 0 valve overlap (as is common)? Where does the air go other than to be used for combustion?
In particular, how can the engine draw more air than is used for combustion if there is 0 valve overlap (as is common)? Where does the air go other than to be used for combustion?
#13
gruntguru
-
- 7,642 posts
- Joined: January 09
Member
Posted 20 May 2009 - 03:03
Zero valve overlap is not common. High VE engines will always scavenge some intake through the exhaust valve during overlap at certain speeds and WOT.Interesting data, but I need to understand more
In particular, how can the engine draw more air than is used for combustion if there is 0 valve overlap (as is common)? Where does the air go other than to be used for combustion?
A percentage of the air may also be unavailable for combustion if there is stratification of the charge (ie regions of intake air that do not come in contact with fuel). J. Edlund - does this air contribute to a lower trapping ratio?
Edited by gruntguru, 23 May 2009 - 03:17.
#14
imaginesix
-
- 7,525 posts
- Joined: March 01
Member
Posted 23 May 2009 - 02:46
Wouldn't that mean that when the TR is 100%, there is no valve overlap? Which would be weird because 100% TR seems to appear intermittently along the rpm range in J. Edlund's data. Yet valve overlap, if it changes, doesn't change intermittently through the rpm range.Zero valve overlap is not common. High VE engines will always scavenge some intake through the exhaust valve during overlap at cartain speeds and WOT.
A percentage of the air may also be unavailable for combustion if there is stratification of the charge (ie regions of intake air that do not come in contact with fuel). J. Edlund - does this air contribute to a lower trapping ratio?
#15
gruntguru
-
- 7,642 posts
- Joined: January 09
Member
Posted 23 May 2009 - 03:15
No, it just means that wave tuning results in scavenging (intake loss through exhaust valve) at some RPM and not others. That's why I said "at certain speeds" in my previous post.Wouldn't that mean that when the TR is 100%, there is no valve overlap? Which would be weird because 100% TR seems to appear intermittently along the rpm range in J. Edlund's data. Yet valve overlap, if it changes, doesn't change intermittently through the rpm range.
Edited by gruntguru, 23 May 2009 - 03:16.
#16
Joe Bosworth
-
- 687 posts
- Joined: May 05
Member
Posted 25 May 2009 - 10:49
I have some fifty years of pretty good data on 500cc and Moto GP M/C engines and F1 from the Coventry Climax and Cosworth eras.
None of it provides any VE data. I am not surprised as I have always known that very few people bother to gather the data and those who do don´t talk (much). I have some spot data but I wouldn´t claim it to be state of modern art and representing anything current that might validate the wilder VE claims.
However my data yields BMEP at max HP trends over the period.
If people think that BMEP at max HP trends reasonably represent/track VE trends then I will correlated and publish what I have. If people don´t think that the data means anything to them I won´t bother.
Regards
#17
J. Edlund
-
- 1,323 posts
- Joined: September 03
Member
Posted 25 May 2009 - 19:16
A percentage of the air may also be unavailable for combustion if there is stratification of the charge (ie regions of intake air that do not come in contact with fuel). J. Edlund - does this air contribute to a lower trapping ratio?
The simulation model doesn't take that into consideration.
Wouldn't that mean that when the TR is 100%, there is no valve overlap? Which would be weird because 100% TR seems to appear intermittently along the rpm range in J. Edlund's data. Yet valve overlap, if it changes, doesn't change intermittently through the rpm range.
A trapping ratio of 100% doesn't have to mean that there isn't any valve overlap, running without any overlap at all is rare.
The engine in the simulation does however have CVVT on both the intake and the exhaust cam so valve overlap can change with engine speed, although I haven't checked what kind of overlap the engine is using at the different speed points. I already had the GTpost file with the results so it was easy to include just that data.
#18
gruntguru
-
- 7,642 posts
- Joined: January 09
Member
Posted 26 May 2009 - 01:38
I am not surprised at he lack of VE data. It is not as useful without the trapping ratio and much harder to measure.I have some fifty years of pretty good data on 500cc and Moto GP M/C engines and F1 from the Coventry Climax and Cosworth eras.
None of it provides any VE data. I am not surprised as I have always known that very few people bother to gather the data and those who do don´t talk (much). I have some spot data but I wouldn´t claim it to be state of modern art and representing anything current that might validate the wilder VE claims.
However my data yields BMEP at max HP trends over the period.
If people think that BMEP at max HP trends reasonably represent/track VE trends then I will correlated and publish what I have. If people don´t think that the data means anything to them I won´t bother.
Regards
Max BMEP or BMEP at max torque would probably be closer to peak VE. Do you have that data Joe?
#19
Joe Bosworth
-
- 687 posts
- Joined: May 05
Member
Posted 02 June 2009 - 04:07
I have the BMEP numbers I mentioned in post #16 together in some presentable form.
As previously noted I have a lot of M/C engine data going back to the early Fifties as well as some F1, 2 and 3 data interspersed with other useful bits of cutting edge engine data. All of the data I provide here represents pretty honest data, either from dyno runs I have witnessed or data from reliable runs given to me by others. Popularly published data is only used when it can be reasonably supported by comparison to known data sets. For example, I have data from a 1949 AJS E90 that provides a BMEP value that wasn’t met by good data for over ten years. Dump that data.
Early 1950s Gilera and Norton Manx show BMEP numbers just below 150 psi. By the late 1950s this had risen to the 160 to 165 psi range, largely in one step about the time of the first winning MV Augustas. By contrast, by this time the Coventry Climax 1100 FWA was showing BMEPs of just under 140 with a single cam engine with 15 hour life between rebuilds. The BMEP jump from here to the next era will be highlighted later.
The 1960s saw the MVs in four-cylinder form winning the world championships year after year with BMEPs starting with 170 psi and remaining relatively dormant to improvement right up to the beginning of the two-stroke era in 1975. In 1966 MV went to a three cylinder with some pretty wild BMEP claims but by 1973 had reverted to the four with a BMEP of 172.
By comparison, during this period the 2½ litre Coventry Climax topped out at a BMEP of 180 about 1962-3 after several years of F1 and on into development for sports car and Tasman formula use.
Commencing with 1961 F1 became a 1.5 litre formula. First efforts had BMEPs of just under 175 psi at peak HP. By 1964 the best BMEPs had risen to just under 180 psi. (Worthy of note that peak BMEPs were about 195 at 2000 RPM below max HP.) These values corresponded pretty closely to M/C best practice. Interestingly, by the end of the 1.5L formula HP continued to rise but without improvement in BMEP.
The year 1967 found the 3L Cosworth DFV in action. This was/is arguably the most effective F1 engine of all time. At the beginning the DFV had a peak HP BMEP of right at 190 psi. During its development over a dozen years the BMEP rose to 203 and then fell back to just over 190 as peak HP revs rose. Over this period peak HP rose by about 100 HP. By comparison the Matra F1 engine had a BMEP of 166 psi and by verbal advice the Ferrari was similar. The DFV really set a design standard for a long time.
I have some good data from F2, F3 and similar for the same periods which pretty well verify the above figures.
In the M/C world the four-stroke returned in 2002. In the first three Moto years BMEPs ran in the +/- 185 range. In the 2006-8 years this has risen to +/- 190 psi.
I will finish this historical perspective to note BMEP figures calculated for the current day F1 and NASCAR engines. I am careful to note though that these values do not come from HP/RPM data that I cannot verify even by second hand knowledge. However, the peak HP BMEP for F1 seems to be about 210 or a bit less while the NASCAR Cup engines are approaching 200 psi.
What does this all mean for VE?
There are four factors that strongly affect BMEP. They are VE and losses through friction, inertia, compression ratio and heat loss.
The early improvements in BMEP noted from my data were probably heavily affected by compression ratio gains allowed by fuel improvements. However this path probably has not added much to BMEP since the mid sixties. By then very good fuels were available and CR improvements for HP become asymptotic.
Friction, inertia and heat loss improvements are likely to be large contributors to BMEP improvements particularly since about 1970 or so.
It appears that since about 1975 that BMEPs have improved very close to 10% for each of F1 and M/C to this day.
I won’t try to conclude how much of this 10% improvement came from VE and how much from improvements to friction, inertia and heat loss.
But it is fair to conclude that VE improvement over this long period is in the range of 2.5 to 7.5 percentage points. Other data that I have indicates that VE improvements are at the lower end of this range but I wouldn’t argue too strongly if others had information that indicate closer to the higher end of the range.
Advertisement
#20
gruntguru
-
- 7,642 posts
- Joined: January 09
Member
Posted 02 June 2009 - 11:52
The distinction between "Peak BMEP" and "Peak Power BMEP" is important. It is also important that we use the same number when comparing two or more engines. It sounds like your data is "Peak Power BMEP".I have the BMEP numbers I mentioned in post #16 together in some presentable form. . . . . .
Finally, the high claim mentioned in the first post would certainly be "Peak VE" and would occur close to the rpm of peak BMEP (same as peak torque rpm)
#21
Joe Bosworth
-
- 687 posts
- Joined: May 05
Member
Posted 02 June 2009 - 16:59
The BMEPs that I quote above are BMEP at max HP except where noted.
For many of the engines I have peak BMEP as well but in general the peak BMEPs are some 8 to 12 psi above BMEP at max HP. I didn´t quote peak BMEP generally above as my data is not as complete.
The major factor is that BMEPs, both peak and at max HP, have remained relatively stagnant over a very long period of time indeed. In as much as VE is a major contributor to BMEPs (both kinds) we can judge that there have been no break throughs in VE over the saame relatively stagnant period. The generally held belief that VEs, (whole volume kind - not trapped volume), have peaked at near 115% seems to have held up for a long time.
#22
gruntguru
-
- 7,642 posts
- Joined: January 09
Member
Posted 04 June 2009 - 04:21
I doubt there will be any breakthroughs because there is a theoretical limit for VE. I have never investigated the details but common sense tells us that 100% is the limit for static filling and the dynamic filling on top of that would be be limited by peak intake gas velocity which is in turn limited by piston speed times the (bore area)/(intake area) ratio. Obviously if we make that ratio too big the intake ports will become excessively restrictive.The major factor is that BMEPs, both peak and at max HP, have remained relatively stagnant over a very long period of time indeed. In as much as VE is a major contributor to BMEPs (both kinds) we can judge that there have been no break throughs in VE over the saame relatively stagnant period. The generally held belief that VEs, (whole volume kind - not trapped volume), have peaked at near 115% seems to have held up for a long time.
J. Edlund said in a previous post that 130+% would be possible for the whole volume kind of VE.
#23
Joe Bosworth
-
- 687 posts
- Joined: May 05
Member
Posted 04 June 2009 - 09:58
Grunt
You post, ´limited by peak intake gas velocity which is in turn limited by piston speed times the (bore area)/(intake area) ratio´
Piston speed is important but it appears that an average port velocity calculated at immediately behind the valve seats is even more important. This value has not changed in nearly 50 years of engine develoment.
I might take the time to do some calculations on the ratio you spell out to see if this has changed much over time but that will take a bit of effort so don´t expect a quick response. That is unless you want to publish your data.
My 80 mps with a margin of about 5% upwards is rock solid except for a very very few outliers that crop up very seldom.
I have not tried to research why this is so but I suspect the reasons. It might come about for the very same reasons that the absolutely optimum velocity for industrial ducts that convey dust is 3500 fpm.
Regards
#24
gruntguru
-
- 7,642 posts
- Joined: January 09
Member
Posted 04 June 2009 - 10:35
On reflection, I seem to recall peak intake gas velocity reaching near-sonic levels and of course mach 1 is an absolute limit for orifice flow, so maybe this sets the upper limit for dynamic cylinder filling?Piston speed is important but it appears that an average port velocity calculated at immediately behind the valve seats is even more important. This value has not changed in nearly 50 years of engine development.
#25
Canuck
-

- 2,388 posts
- Joined: March 05
Member
Posted 05 June 2009 - 03:49
This is a new metric for me and I'd like to add it to my chart. Based on the following information:... be limited by peak intake gas velocity which is in turn limited by piston speed times the (bore area)/(intake area) ratio.
Piston Speed of 22.7mps, 4-valve design with 27.2mm intake valves and a 67mm bore;
I'm calculating 68.8mps - is that correct or have I fouled up the 2-valve / 4-valve bit?
#26
gruntguru
-
- 7,642 posts
- Joined: January 09
Member
Posted 05 June 2009 - 06:30
Yep - that's right - however -This is a new metric for me and I'd like to add it to my chart. Based on the following information:
Piston Speed of 22.7mps, 4-valve design with 27.2mm intake valves and a 67mm bore;
I'm calculating 68.8mps - is that correct or have I fouled up the 2-valve / 4-valve bit?
The smallest area in the throat just below the valve will be smaller than the valve - about 0.8 times valve dia or 21.76mm in your example. This will give a velocity of 107.6 m/s.
This is still not the peak velocity because peak piston speed is about 58% higher than average piston speed (I assume 22.7 is your mean piston speed) so peak piston speed = 22.7 x 1.58 = 35.8 m/s (only three times as fast as a quick human being on foot). This brings the peak intake velocity up to 170 m/s (about mach 0.5).
Of course this is a much simplified analysis as it assumes an incompressible working fluid, but it does put us in the ballpark.
The dynamic pressure at this velocity is rho(air density) x (v^2) / 2 = 1.293 x 170^2 / 2 = 18.7 kPa = 0.18 bar. So if all of this dynamic pressure could be used to help fill the cylinder at BDC it would increase the cylinder filling by 18% for a VE of 1.18. Once again this a grossly simplified analysis but it sets a kind of "upper limit" by defining what energy is availlable in the intake for "resonance supercharging".
Other factors contributing to VE include resonance tuning on the exhaust side to draw scavenging air through the cylinder during valve overlap.
Edited by gruntguru, 05 June 2009 - 06:33.
#27
Joe Bosworth
-
- 687 posts
- Joined: May 05
Member
Posted 05 June 2009 - 07:23
Grunt suggests:
"The smallest area in the throat just below the valve will be smaller than the valve - about 0.8 times valve dia or 21.76mm in your example. This will give a velocity of 107.6 m/s."
I suggest:
.8 factor is rather generous being either more wasteful of port throat diameter being utilised or a valve size rather wasteful of valve weight for any race engine application I have worked on.
Using the example at question with 27.2 mm valve.
.8 factor for throat diamete gives you 21.76 mm
gives a difference of diameters of 5.44 mm
or 2.72 mm radius difference
I would either be opening up the diameter or if I had the dia I wanted then I would be slimming seat widths and machining valve daimeters to save weight.
.8 is probably not too bad a figure for your 300,000 km go to store vehicle once upon a time but I suspect that even your Honda Civic is running tighter than this.
#28
gruntguru
-
- 7,642 posts
- Joined: January 09
Member
Posted 05 June 2009 - 10:41
Sorry Joe, I was working from (my very poor) memory. Now I am home, I've dragged out my 1971 copy of Cylinder Head Modification by David Vizard and looked up the "Race Engine Venturi Port" and yes the throat diameter suggested is 0.9 x valve diameter not 0.8Grunt suggests:
"The smallest area in the throat just below the valve will be smaller than the valve - about 0.8 times valve dia or 21.76mm in your example. This will give a velocity of 107.6 m/s."
I suggest:
.8 factor is rather generous being either more wasteful of port throat diameter being utilised or a valve size rather wasteful of valve weight for any race engine application I have worked on.
Using the example at question with 27.2 mm valve.
.8 factor for throat diameter gives you 21.76 mm
gives a difference of diameters of 5.44 mm
or 2.72 mm radius difference
I would either be opening up the diameter or if I had the dia I wanted then I would be slimming seat widths and machining valve daimeters to save weight.
.8 is probably not too bad a figure for your 300,000 km go to store vehicle once upon a time but I suspect that even your Honda Civic is running tighter than this.
This changes the velocities previously calculated by a factor of 0.81 so the average velocity goes from 107.6 to 87 m/s and the peak velocity from 170 to 138 m/s.
Edited by gruntguru, 05 June 2009 - 10:43.
#29
Canuck
-
- 2,388 posts
- Joined: March 05
Member
Posted 05 June 2009 - 22:53
That's within 1m/s of the formula I use at the moment now (in terms of Mean). Thanks for clearing that up.
#30
gruntguru
-
- 7,642 posts
- Joined: January 09
Member
Posted 06 June 2009 - 03:46
I suspect the formula you use now includes rpm, cylinder capacity and throat area? If so its the same formula rearranged.That's within 1m/s of the formula I use at the moment now (in terms of Mean). Thanks for clearing that up.
#31
Canuck
-
- 2,388 posts
- Joined: March 05
Member
Posted 08 June 2009 - 23:21
Yes, I just wanted to see how it compared. It's always interesting to see the various means to an end - different variations on a formulaic theme as it were. I.E.
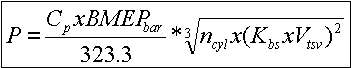
or
P = (Ap*BMEP*MPS) / 132,000
The first one is so much more fun to throw down in a nerd sort of way.
or
P = (Ap*BMEP*MPS) / 132,000
The first one is so much more fun to throw down in a nerd sort of way.
#32
EQH
-

- 1 posts
- Joined: May 09
New Member
Posted 11 June 2009 - 14:52
Grunt
...We see NASCAR running as low as 5K with topping out at close to 8.5 or a bit more..
Regards
Just to clarify this point. Short track and road course engines used in NASCAR Sprint Cup cars will top as high as 10.5k. Intermediate track (1.5 or 2 mile) engine packages will see as high as 9700 to 10k. Sustained 8.5k occur on super speedway tracks (Daytona, Talladega).
#33
McGuire
-

- 9,218 posts
- Joined: October 03
Member
Posted 16 June 2009 - 22:57
That's a bit high. For the past few seasons NASCAR has regulated the gear ratios allowed at each track to limit rpm to around 9400 rpm. Daytona and Talladega are around 8500 max due to the restrictor plate. Max power rpm is actually less than that but plate engines are set up to overspeed in the huge draft.
At Las Vegas this year, NASCAR was a bit off in predicting the conditions and the engines ran 400-500 rpm higher than anticipated, leading to a rash of engine failures. The valvetrains were optimized for +/-9400 rpm and at 9800 rpm they hammered themselves to pieces.
At Las Vegas this year, NASCAR was a bit off in predicting the conditions and the engines ran 400-500 rpm higher than anticipated, leading to a rash of engine failures. The valvetrains were optimized for +/-9400 rpm and at 9800 rpm they hammered themselves to pieces.


