

This chart indicates the percentage of available Constructors Championship points won annually for each of the teams displayed, demonstrating how the fortunes of some of the most important F1 teams have waxed and waned. Annual performance of each team is measured by the vertical thickness of the bar. Cheers.
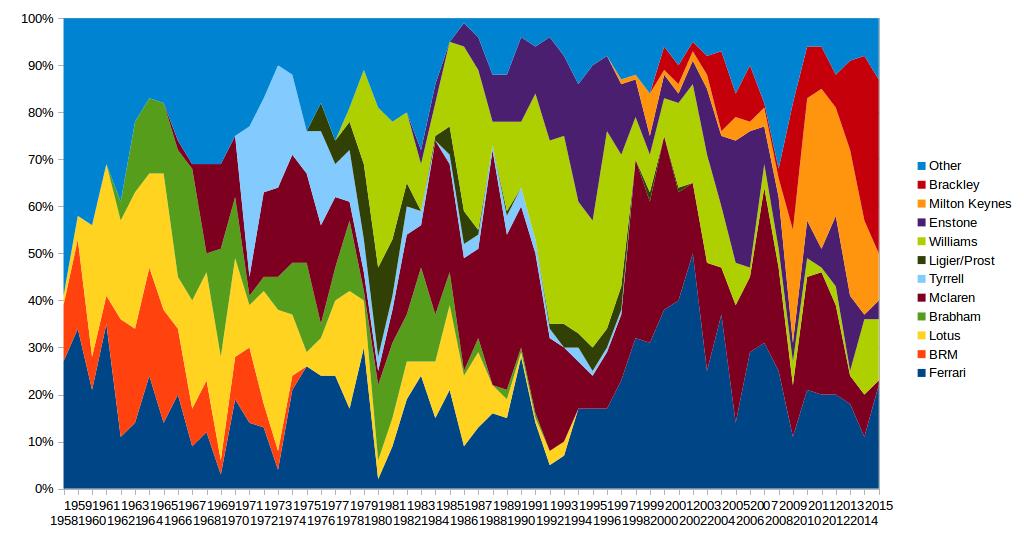
Note: Milton Keyes = (Stewart, Jaguar, & Red Bull); Brackley = (BAR, Honda, Brawn, & Mercedes); Enstone = (Toleman, Benetton, Renault, & Lotus).
I reinstated Mclaren's 2007 points. I did this for 2 reasons: first, it would have skewed the data since Mclaren's finishing positions weren't wiped from the record the way Tyrrell's were in 1984, bumping lower teams up the finishing order; and second, the FIA didn't strip Mclaren's drivers of their points, which suggested the disqualification was due to politics rather than cheating in a manner than made the championships objectionably unfair. We've discussed the issue of reinstating Tyrrell in a similar thread a year or two ago. So far I haven't done it, but at some point it's still a possibility, I suppose.
I'm also open to considering adding another team (perhaps Jordan-Midland-Spyker-Force India or Sauber/BMW Sauber), although the chart is getting crowded.
Edited by Nustang70, 03 December 2015 - 06:36.


 Thanks Marklar and Red Baron for lending a helping hand.


