Jump to content


Photo
* * * * * 1 votes

race pace 2019


  • Please log in to reply
31 replies to this topic

#1 moreland

moreland
  • Member

  • 182 posts
  • Joined: July 17

Posted 15 May 2019 - 18:36

Hi, it's a little late, but here is the 2019 edition of the race pace analysis thread. There are similar threads for the 2017 season here and 2018 season here. The idea is, we take all lap times by all drivers in each race, apply a common statistical method called linear modelling, and produce a best guess for what each driver's outright pace in each race was.
 

We'll start off by explaining the method. The explanation that I gave last year seemed to work so I've virtually cut and paste it here, so if you've read that recently, this might sound familiar. I have however

more recent example to explain the method, I've chosen Romain Grosjean from Spain 2019 since he had a fairly typical race, with many laps in clear air but also a few in traffic.

So, as I said, we want to take the lap times for each driver in each race and from them, calculate what their outright pace was. Each lap time is affected by the amount of fuel on board, the tyres used and the age of the tyre, so we need to estimate the effects of those. In addition, lap times can frequently be affected by being stuck behind other cars, or being involved in overtaking battles, so we filter out these laps.

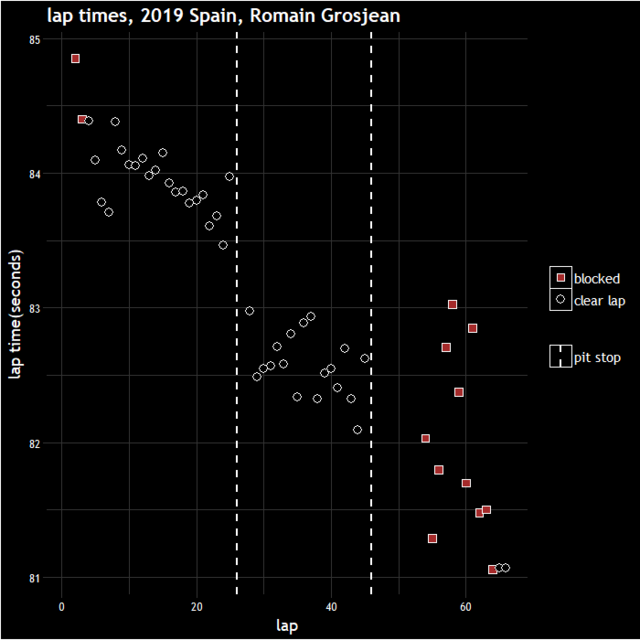
So let's take a look at Grosjean's race in the 2019 Spanish Grand Prix. Here are all of his lap times:

rgrosjean-raw.png


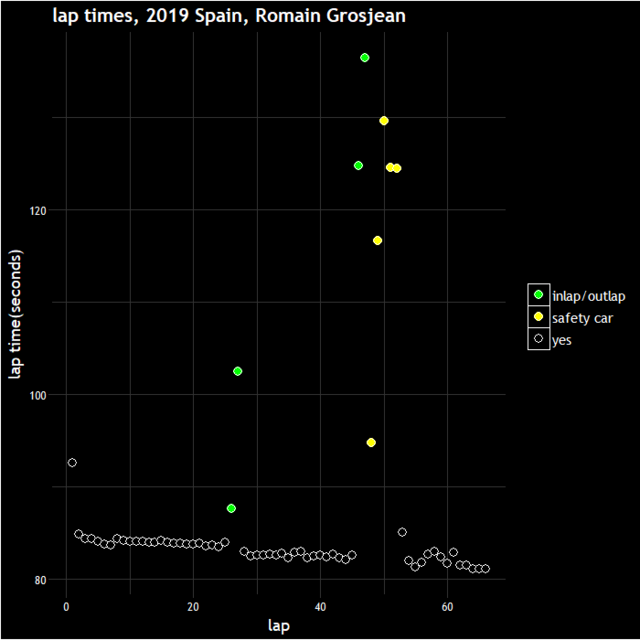
This plot is not great because the scale is dominated by the very slow laps around the pit stops and safety car period, so we'll remove these unrepresentative laps. In general we remove laps done behind the safety car, inlaps, outlaps, lap 1, safety car restart laps and obvious outliers. Next, we'll plot the remaining lap times, but we'll highlight when Grosjean's lap times were affected by traffic. These were at the start of the race before Gasly pulled away, and after the safety car restart while he was involved in battles with Magnussen, Sainz and Kvyat. In general I remove any laps where they overtook someone, got overtaken, got lapped or were blocked. Having done various investigations, I use a definition of being within 1.5 seconds of the car ahead as being blocked.
 

rgrosjean-blockedot.png


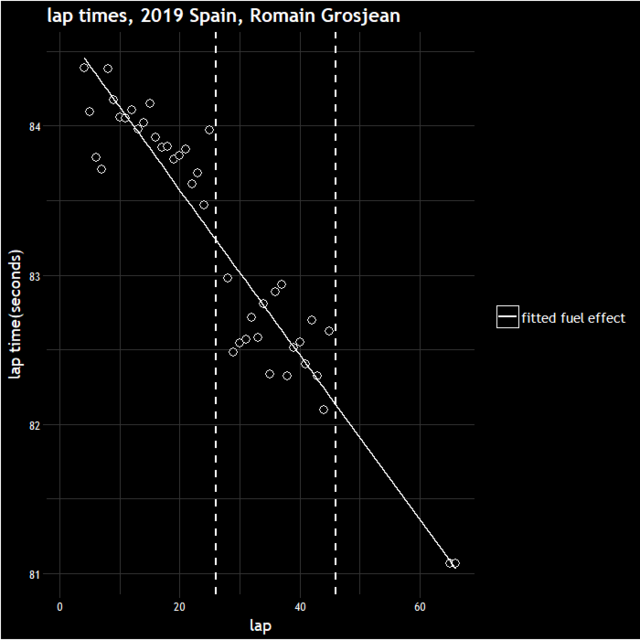
So the 'clear lap's are the useful ones. However, there are factors that affect these lap times, most importantly the fuel load, which tyre was being used and how long it had been used for. So we'll start off by displaying the effect of the fuel load. Below is the plot of Grosjean's 'clear lap' times, but with a line of best fit going through them - this has been obtained by finding the line that passes most closely through all of the lap times for the clear laps. It doesn't pass very closely between them, but we'll deal with that shortly.
 

rgrosjean-fuelfitted.png


Using that line, we can display the lap times for Grosjean correcting for the fuel load. These can be thought of as the lap times he would have set if the car had had only 1 lap of fuel in it, and are displayed with the green points here:
 

rgrosjean-fuelcorrected.png


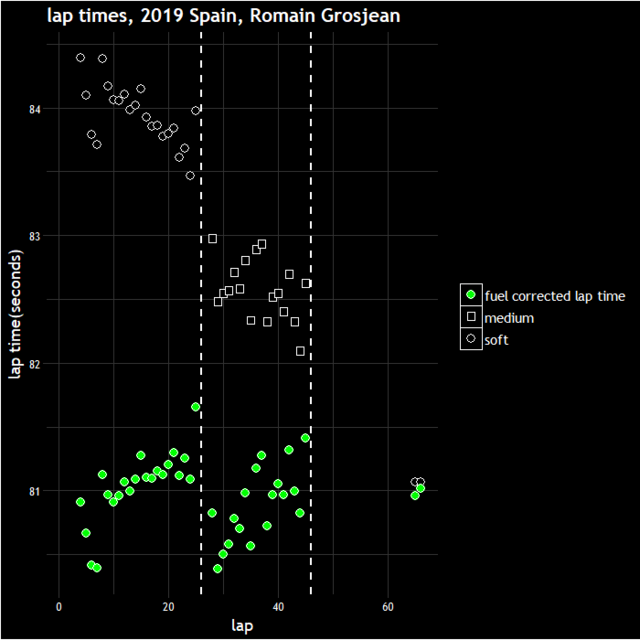
So the biggest trend i.e. lap times dropping throughout the race, has been accounted for. However we notice that the lap times get slower as he gets further into each stint. This is of course the effect of tyre wear. The tyre wear is generally more difficult to estimate accurately than the fuel load because there is quite a lot of variation in how drivers treat their tyres in the race, there are phases when they push and phases when they drop back etc.

There is also the question of whether the tyre wear is different for different cars. There might well be some variation but in this model we group all cars together when estimating the effect of tyres (and the fuel load for that matter). By doing this we get estimates that are certainly close to being accurate for every car and even in the cases where a car does use their tyres a little differently to others, it's rare that it has much of an impact on their final pace estimate because the effects of it tend to balance out over the course of the race.

We'll discuss the tyre wear in more detail later on, but for now we'll display what the effect of the fuel and tyre was for every lap. However, when we say 'tyre effect', it's a bit ambiguous, the effect compared to what? We need to choose a 'reference state' and display how much time was lost compared to it. When we referred to the fuel effect, the reference state was 1 lap of fuel, i.e. we calculated what lap time would have been set with 1 lap of fuel. For tyre, the chosen reference state is a new set of the fastest tyre (when new). As it turns out, the soft tyre is calculated to be the fastest tyre when new.

So here is the display of how each of Grosjean's lap times were affected by fuel, tyre choice and tyre wear on every lap:
 

rgrosjean-fuel-Tyre-Effect.png

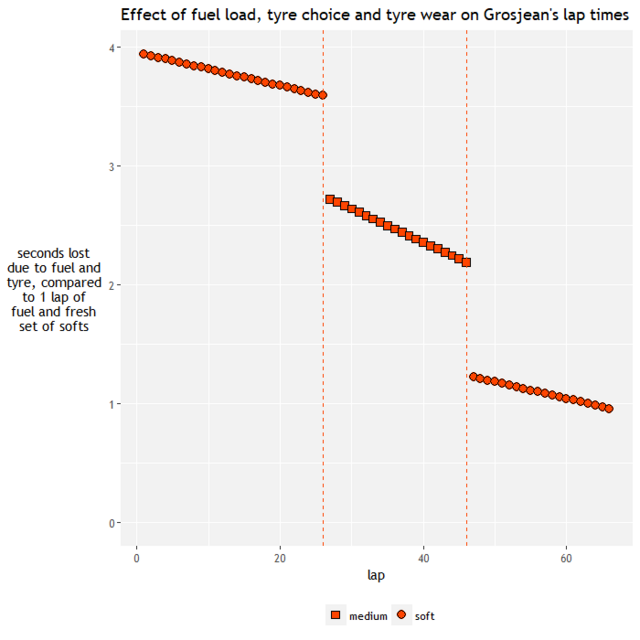
So we see that we take off less and less throughout the race, as his fuel load goes down. However at the end of the race we still take off almost a second: although he's only got 1 lap of fuel left, his softs have worn down so that's costing him about a second compared to a fresh set.

As before, we then take these numbers away from his actual times to get fuel and tyre corrected times:
 

rgrosjean.png


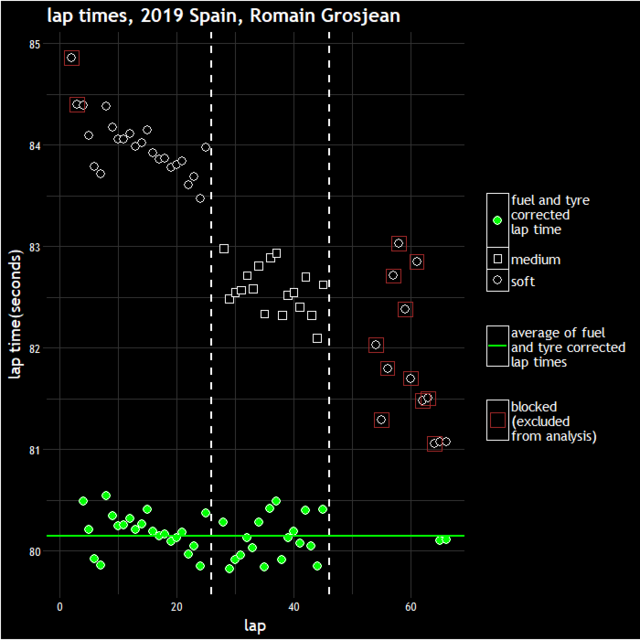
The green line represents the average of all of Grosjean's lap times, accounting for his fuel load and tyres. If Grosjean had driven exactly the same way on every lap, and model was completely correct in estimating the way the Haas used its tyres and fuel loads, then all the green points would lie exactly on the green line. Obviously that isn't the case, so we see a certain amount of scatter.

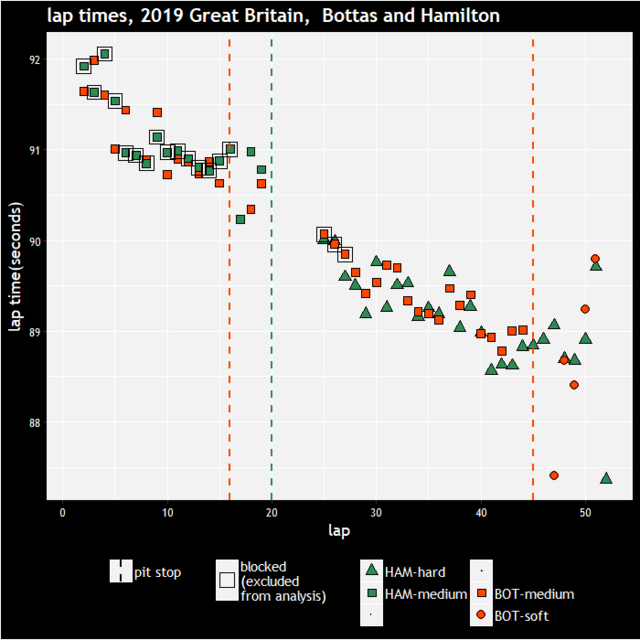
Grosjean's scatter doesn't have too much of a trend to it, but if we look at the equivalent plot for Hamilton for example, we see that he hasn't set lap times quite in accordance with the calculated adjustments for fuel and tyres.
 

lhamilton.png


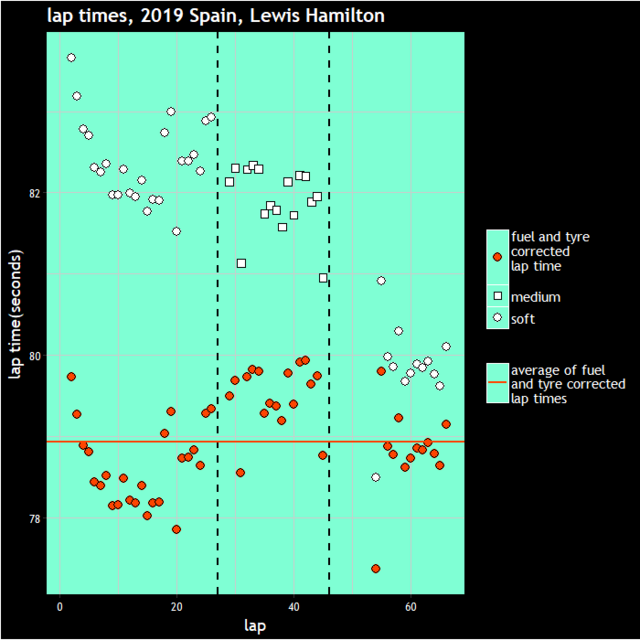
He's faster than we expect in stint 1 but slower in stint 2. This could well be explained by Hamilton's need to push in the first stint in order to build a gap to Bottas prior to his first tyre stop, but to then look after the tyres to the end of the race (which turned out not to be necessary due to the safety car) in the second stint, which he could afford to do given he had an 8 second lead over Bottas during that phase of the race.

So we repeat this process for all drivers and we get the 'average of fuel and tyre corrected lap times' line for all of them, and these represent their race pace estimates. Here are how all the drivers are ranked in the Spanish Grand Prix:
 

2019spain-Race-Pace.png


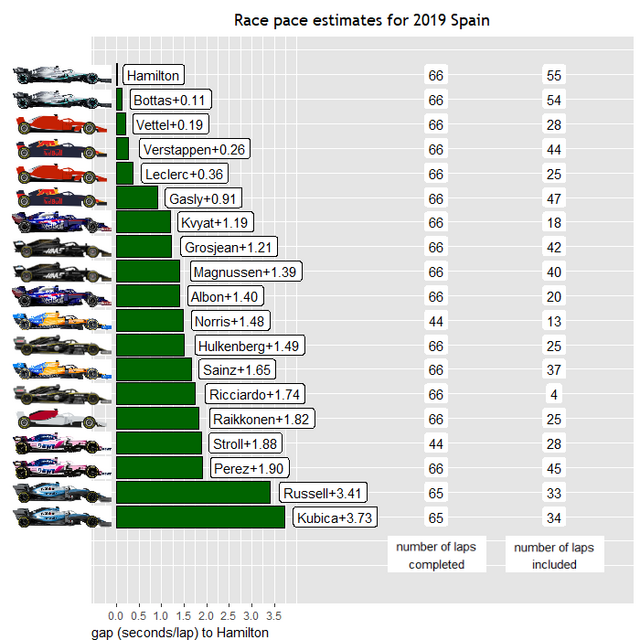
So Hamilton is rated as the fastest driver, unsurprisingly since he won the race quite comfortably. As mentioned above, he could probably have pushed a bit harder in the second stint if necessary so his advantage possibly could have been bigger if he'd needed it to be.

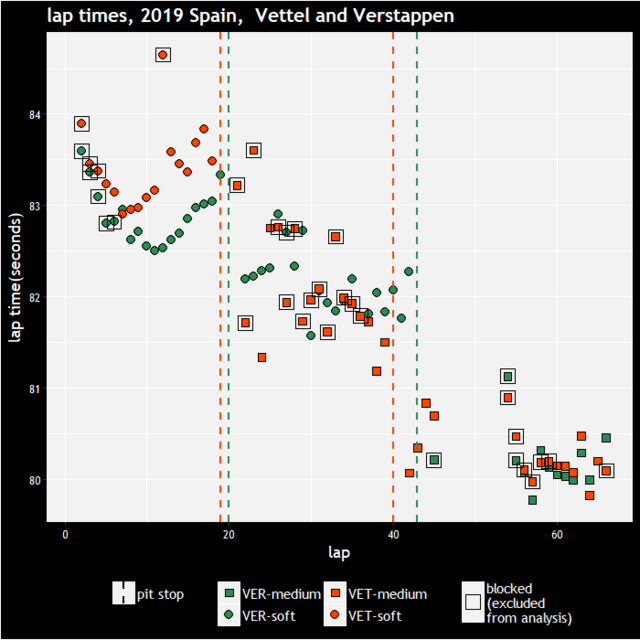
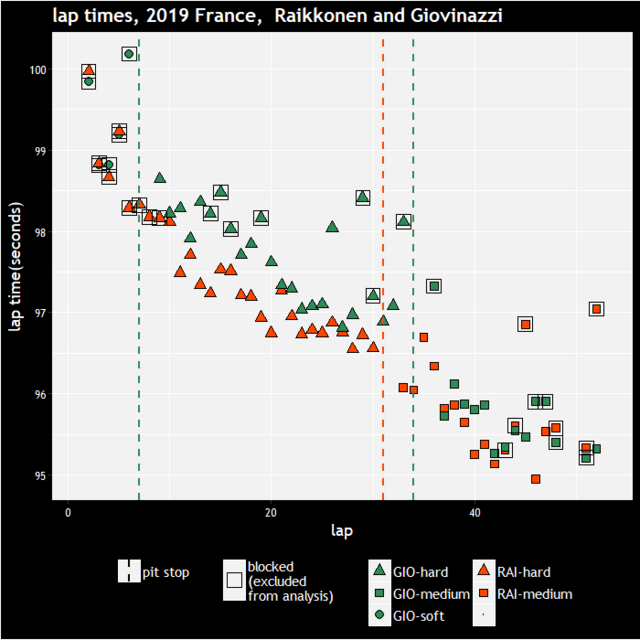
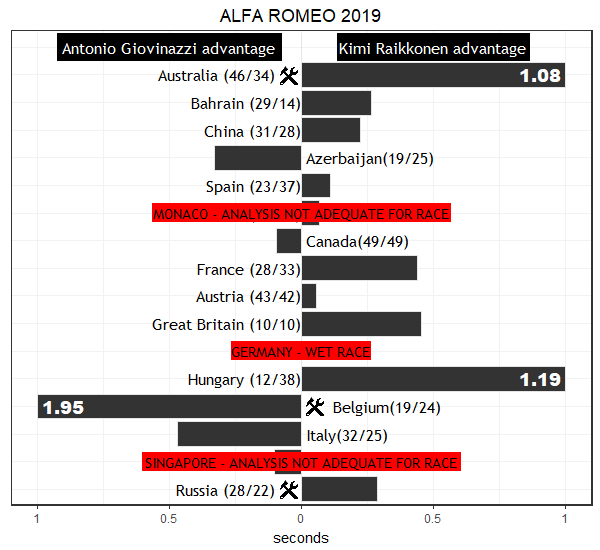
Vettel is rated a little faster than Leclerc, this is a little hard to judge since they were on different strategies but Vettel is rated a little faster mainly due to some very quick lap times in his second stint. One little quirk is that Leclerc's stint in the hard tyres don't count towards his rating, because the hard tyre was not used by many drivers thus we can't estimate what the effect was on lap times. For the same reason, Giovinazzi does not have a rating, since almost all of his clear lap times were on the hard tyre.


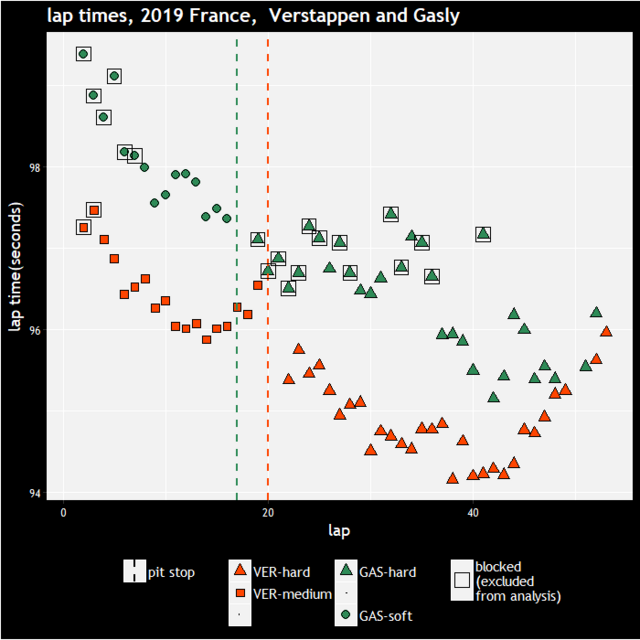
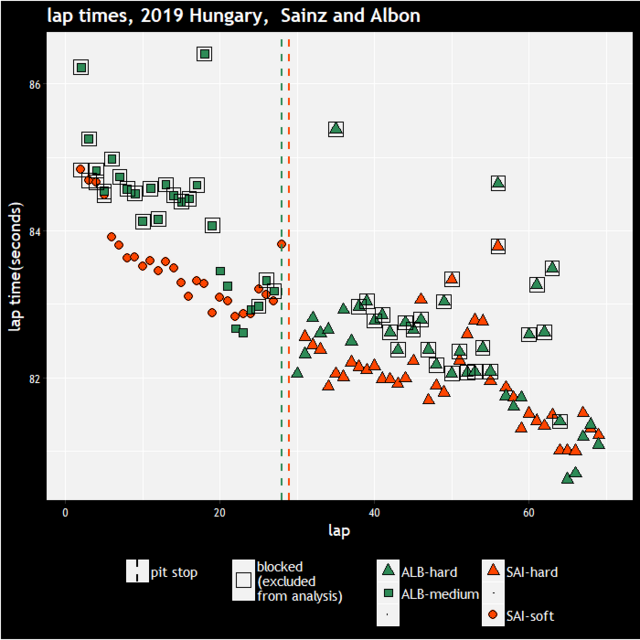
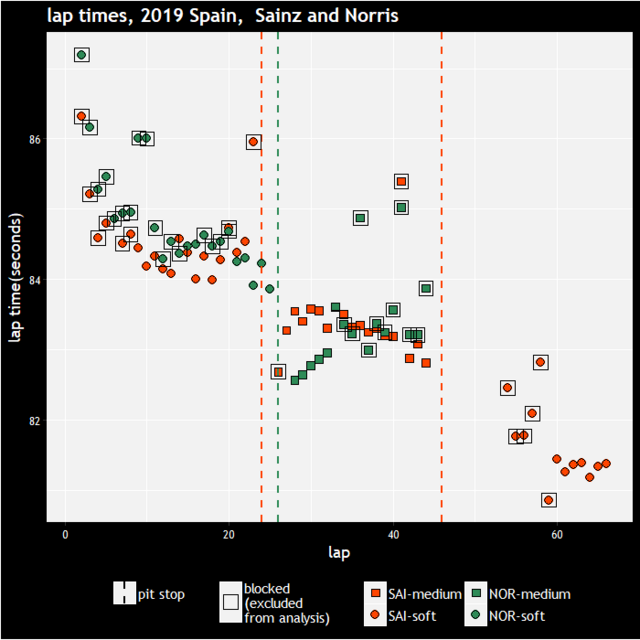
It should be pointed out that the estimates are subject to quite a bit of uncertainty. For example, Norris is rated a little faster than Sainz, but if we compare their lap times side by side, we can see that both of their races were heavily disturbed by traffic and that Norris's advantage is by no means consistent throughout the race:


csainz-lnorris.png

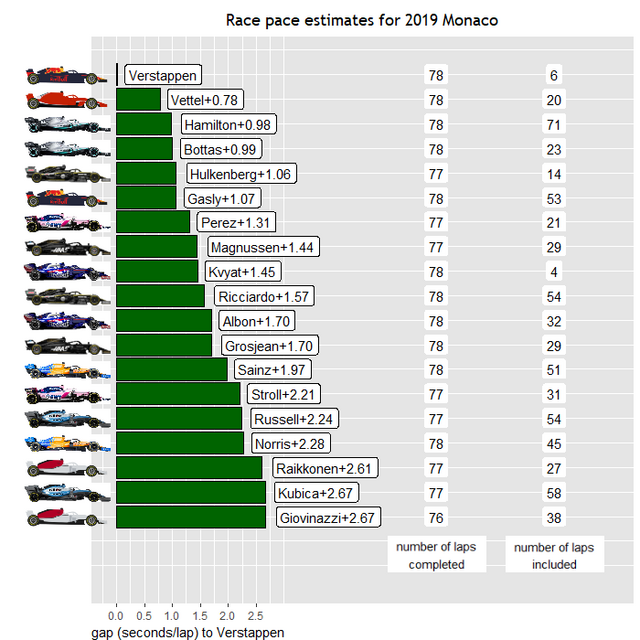
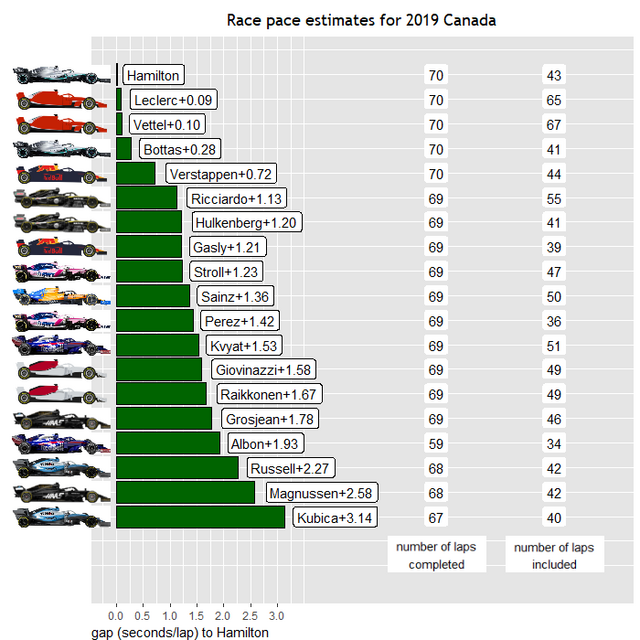
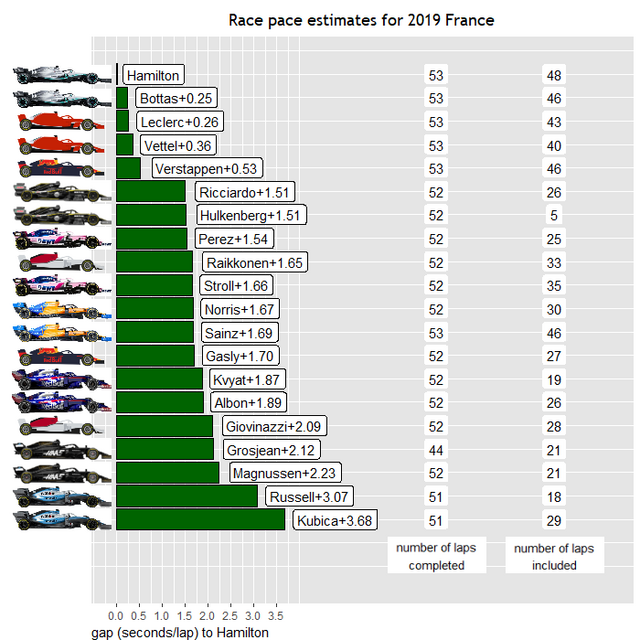
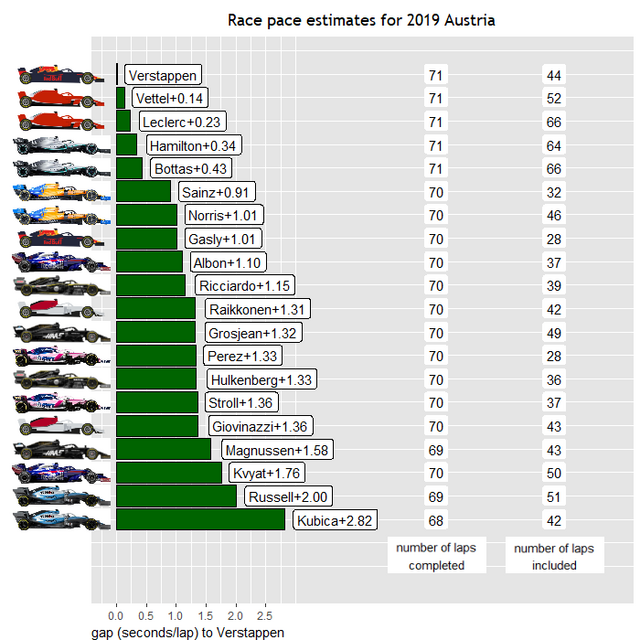
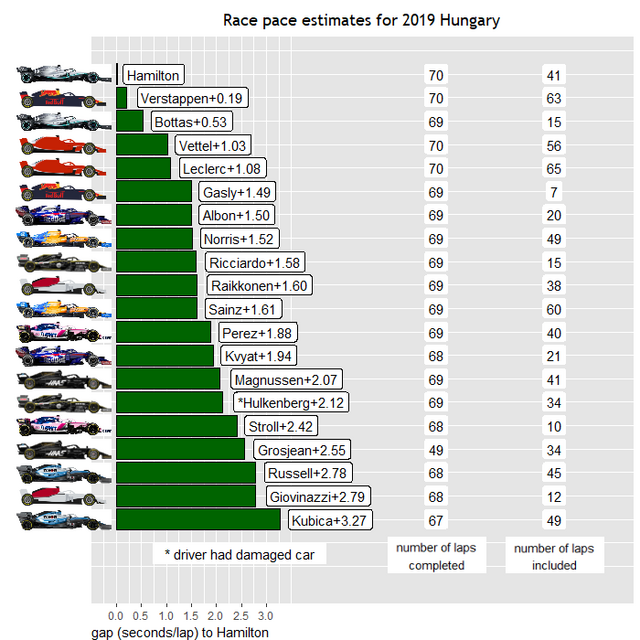
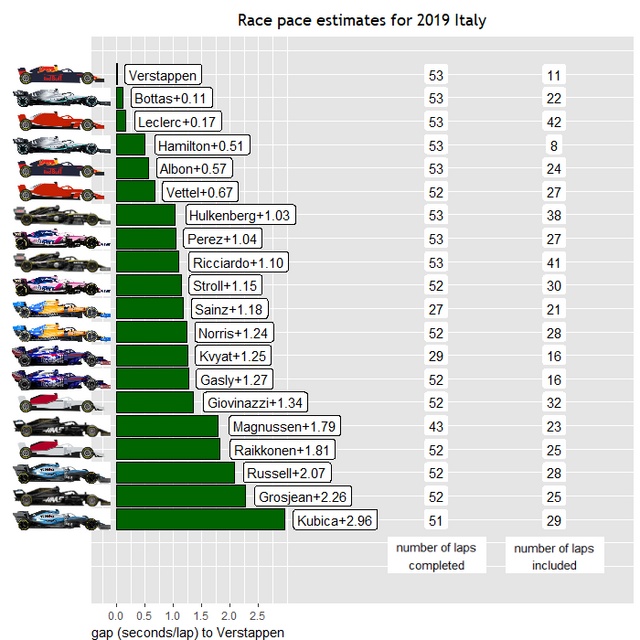
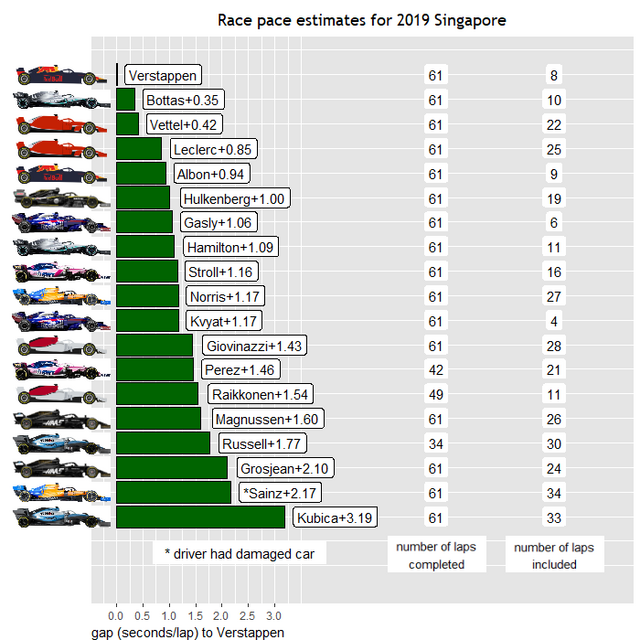
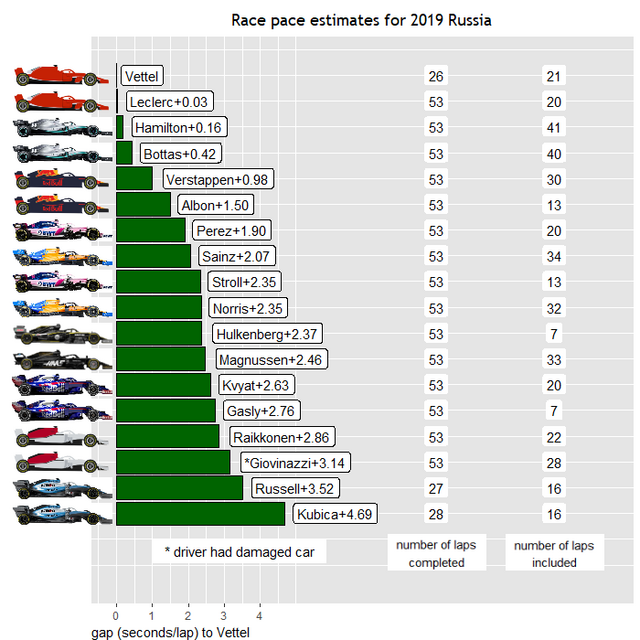
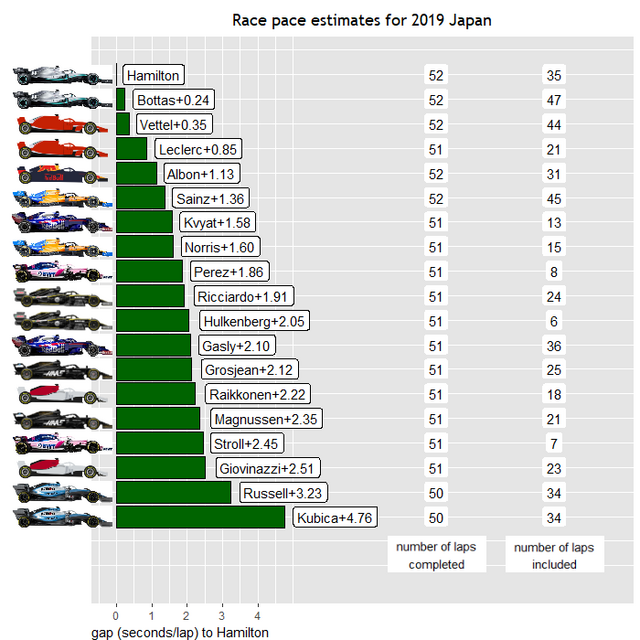
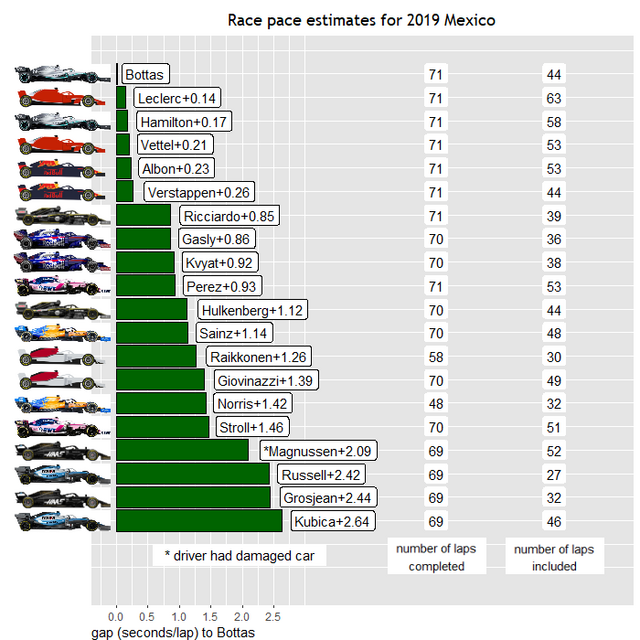
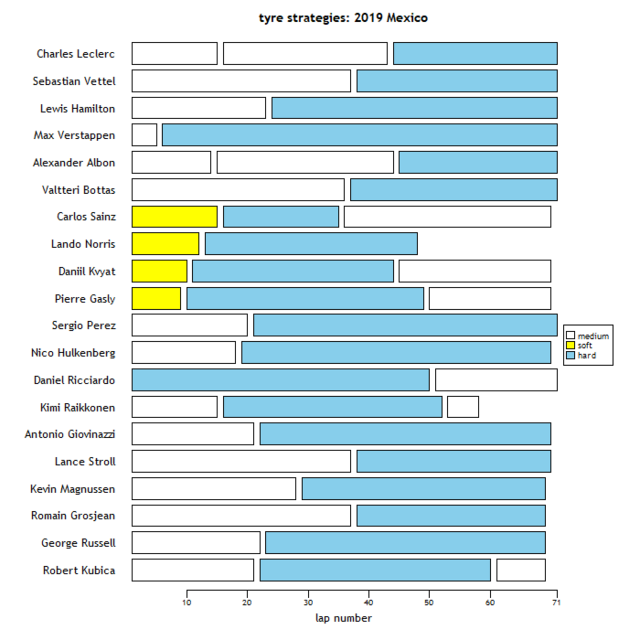
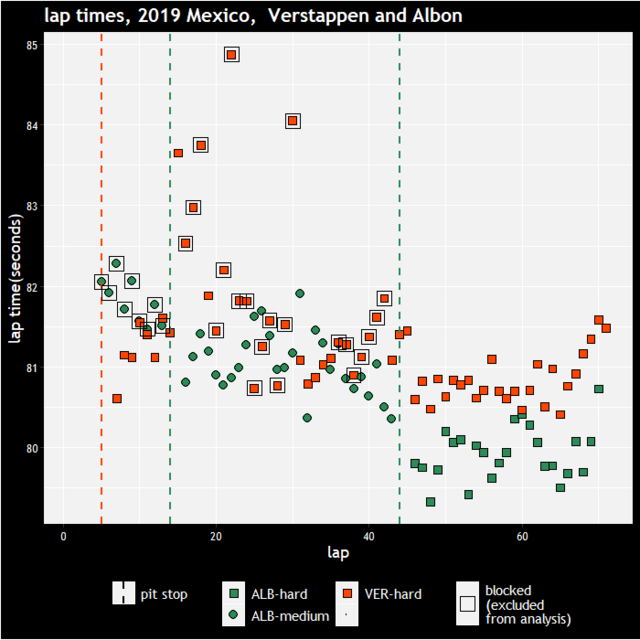
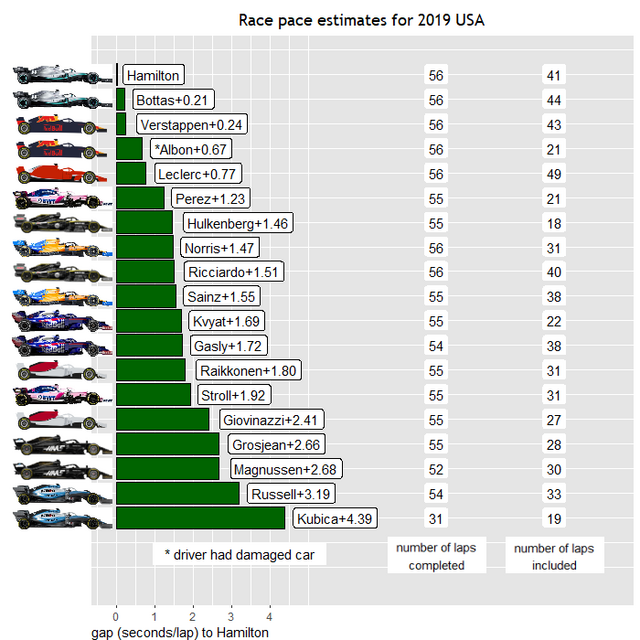
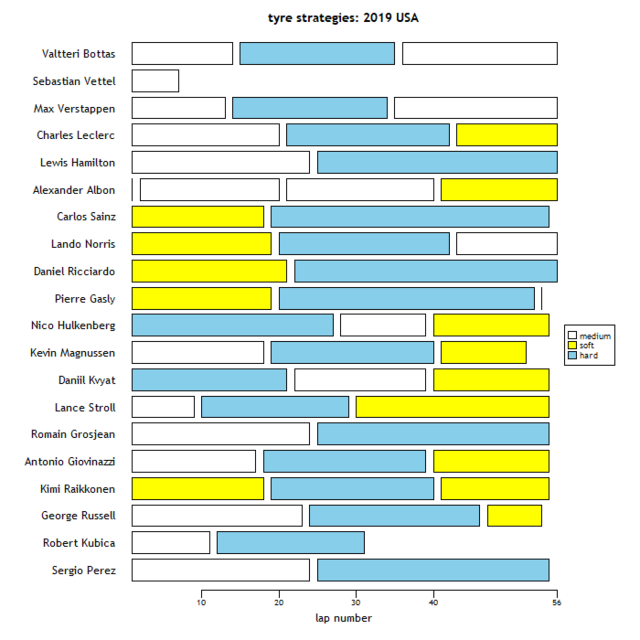
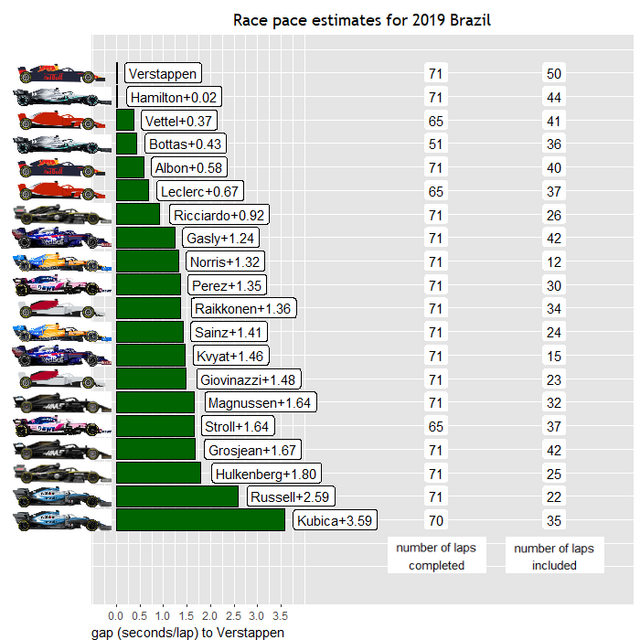
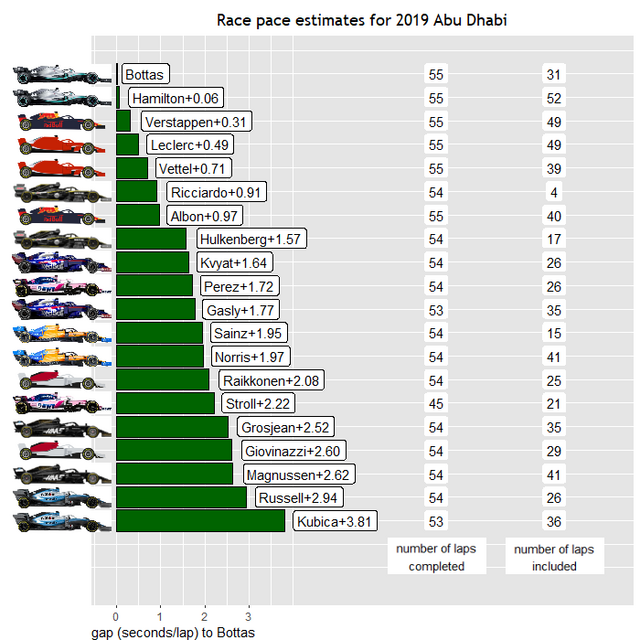
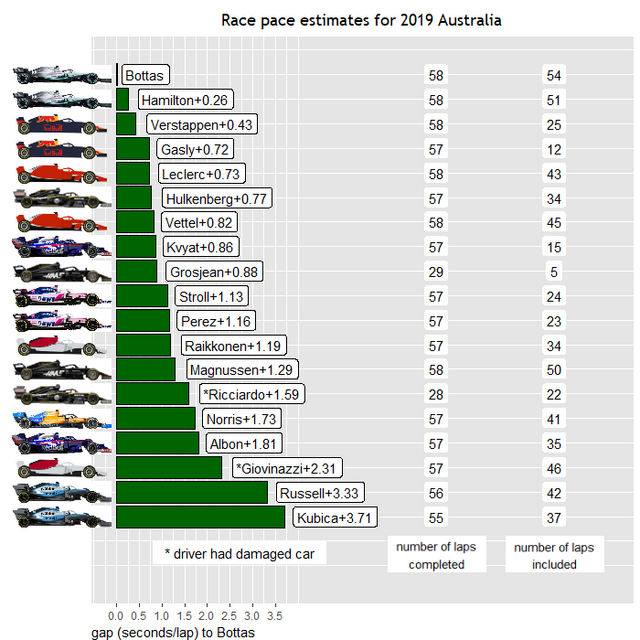
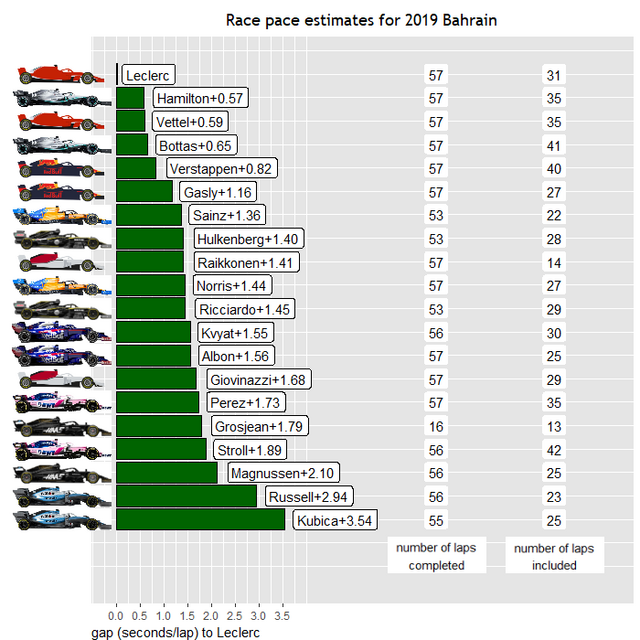
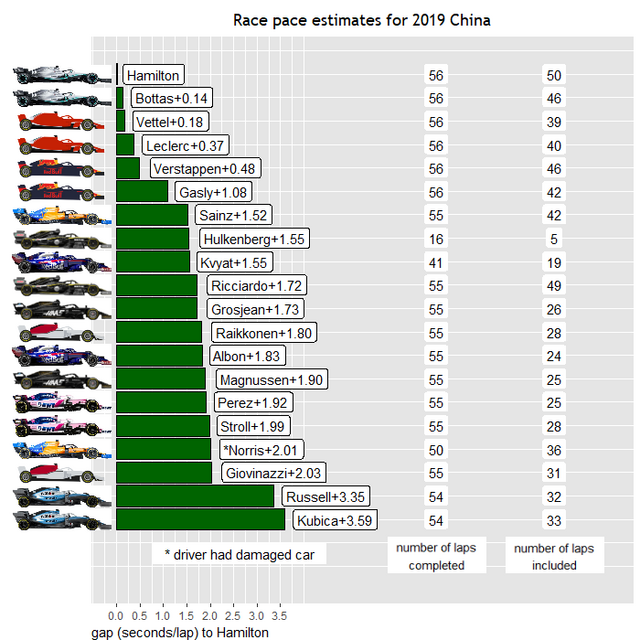
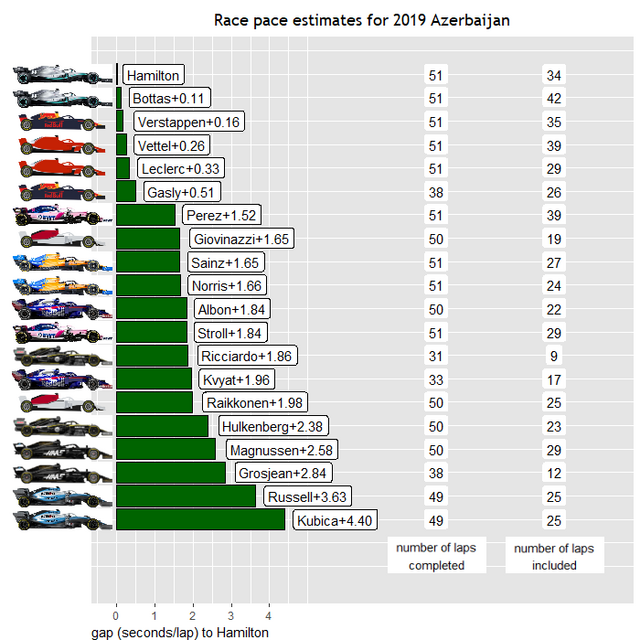
Meanwhile, here are the graphs for the rankings for the other races this season. I'd say that all races have been quite suitable for the analysis because they've all featured a reasonable amount of field spread. I think it's fair to say that the races have overall been somewhat uneventful so far, but on the bright side, the less chaotic the races, the more reliable these rankings are! If you've got any queries about certain race/driver estimates, I'm happy to display the plots detailing how the calculations have been done.


2019australia-Race-Pace.png


2019bahrain-Race-Pace.png


2019china-Race-Pace.png


2019azerbaijan-Race-Pace.png


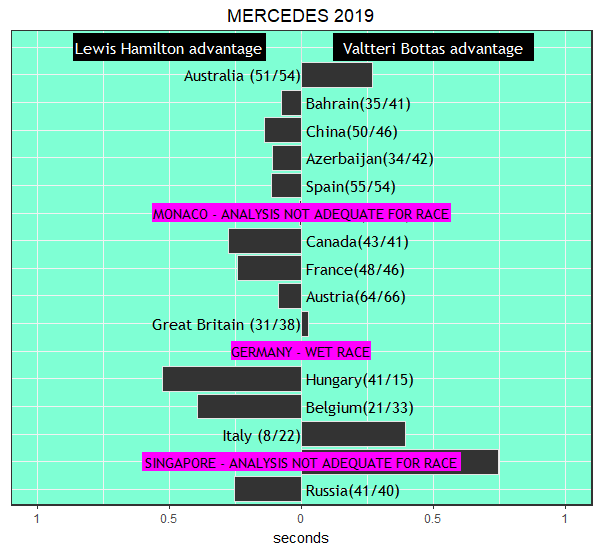
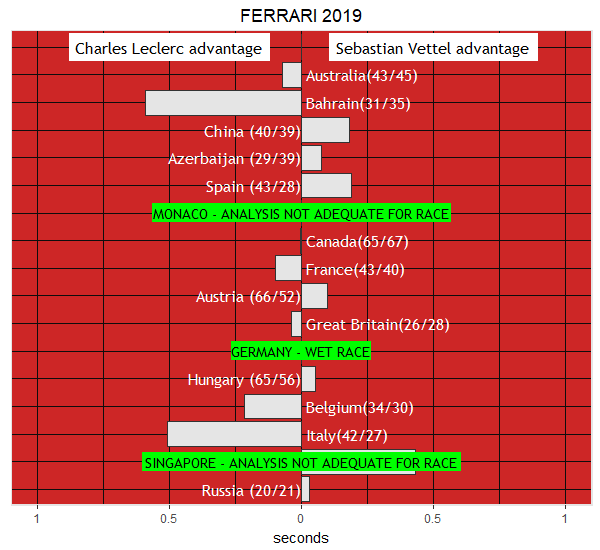
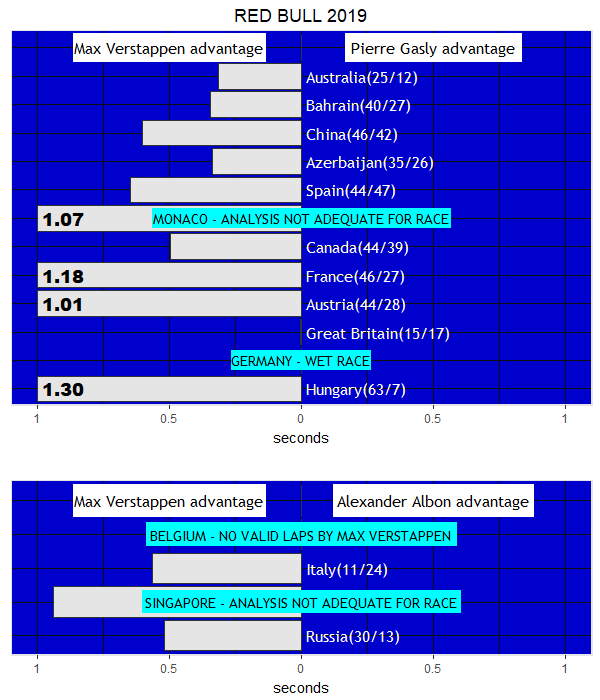
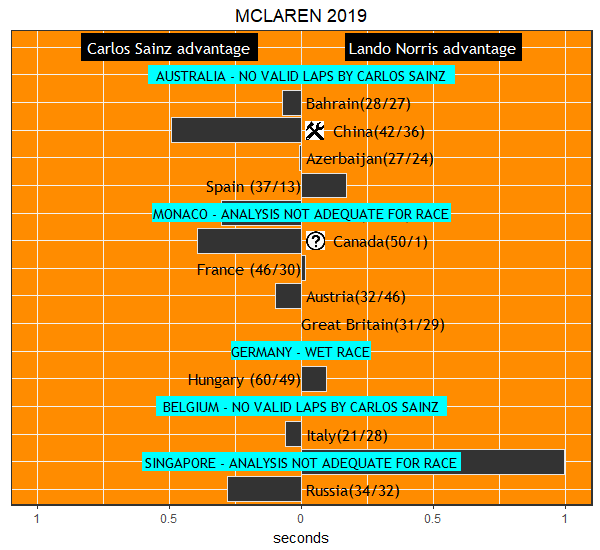
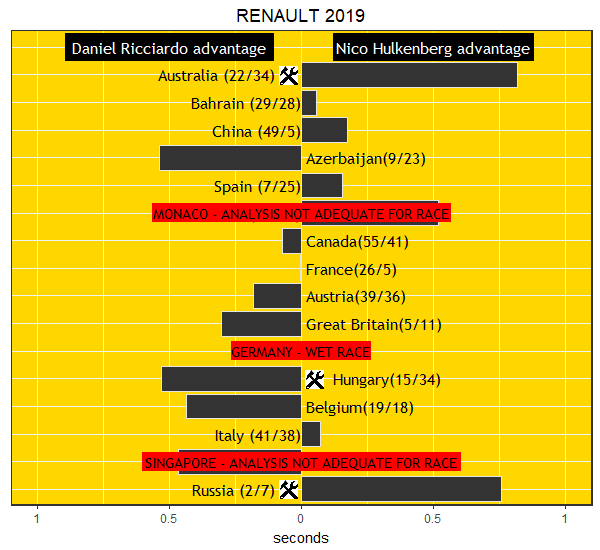
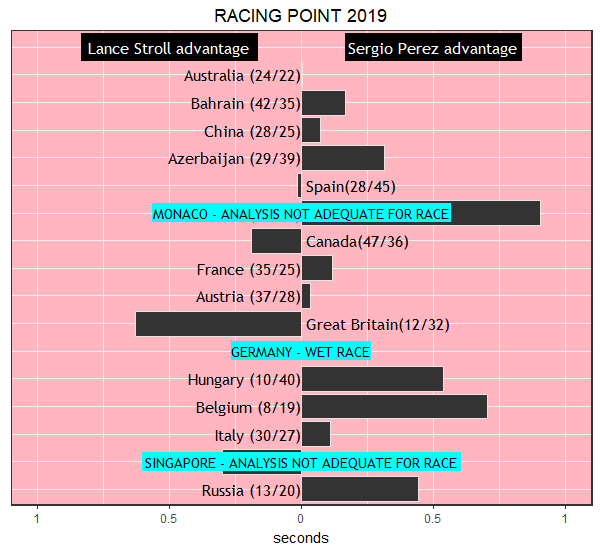
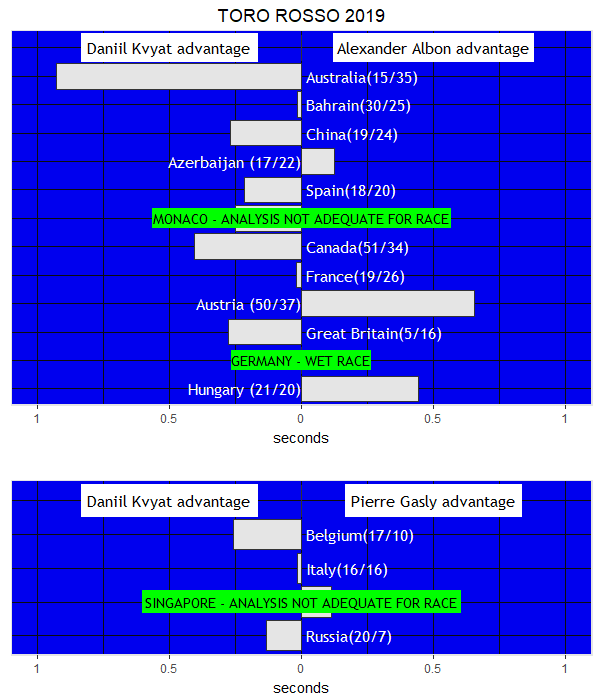
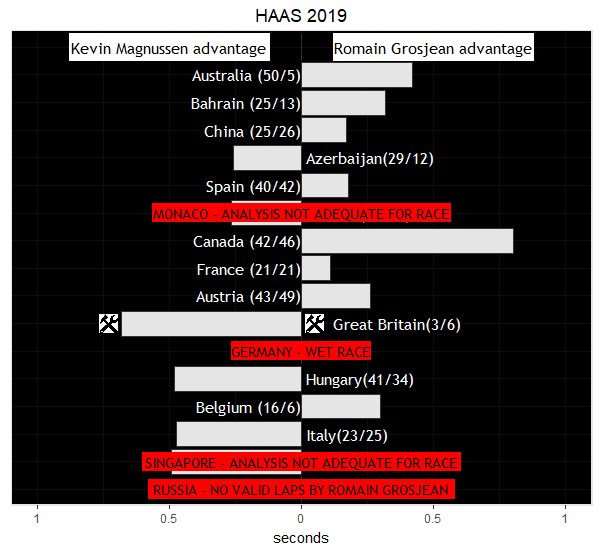
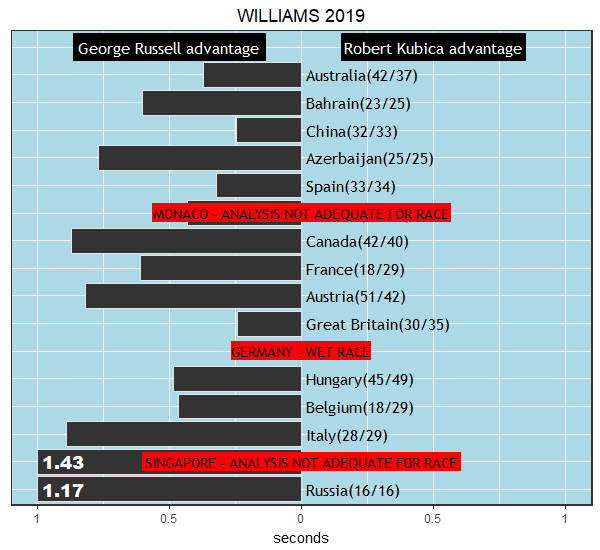
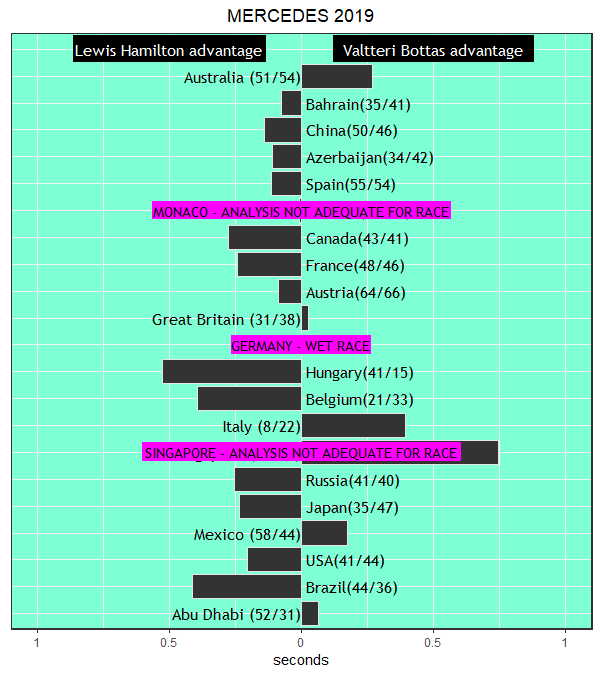
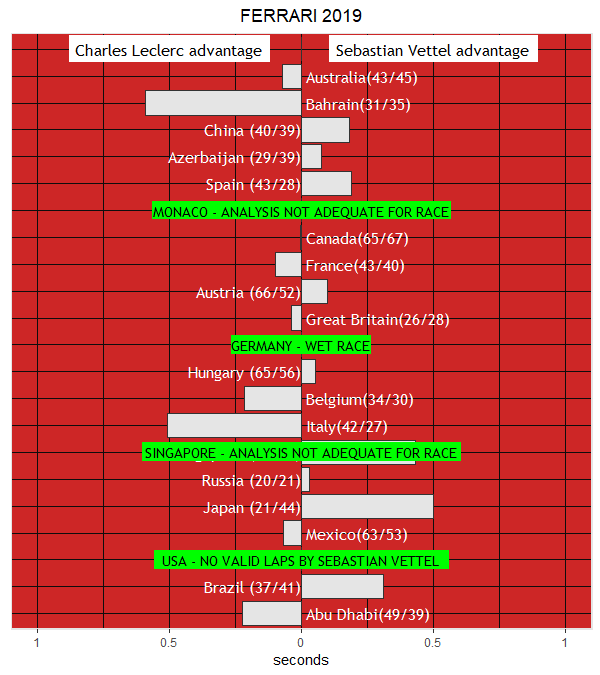
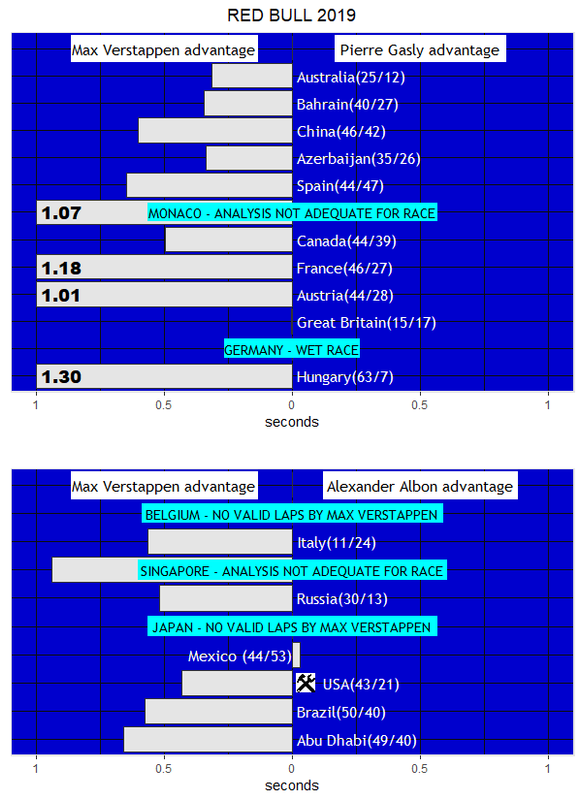
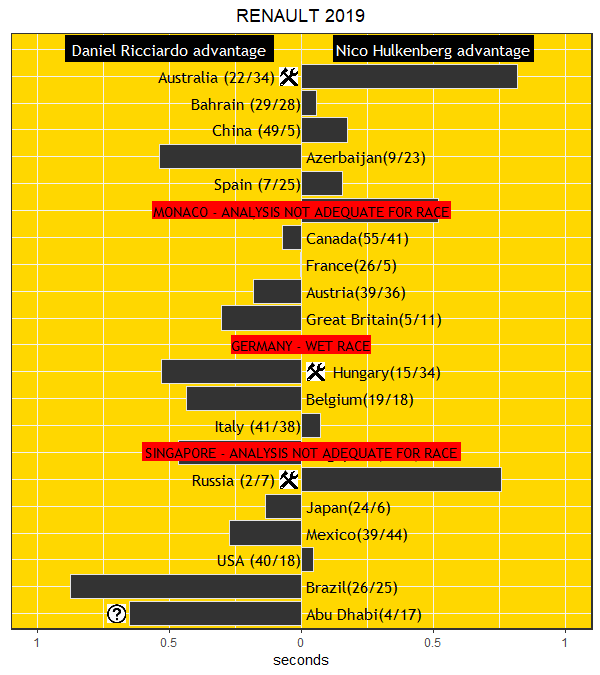
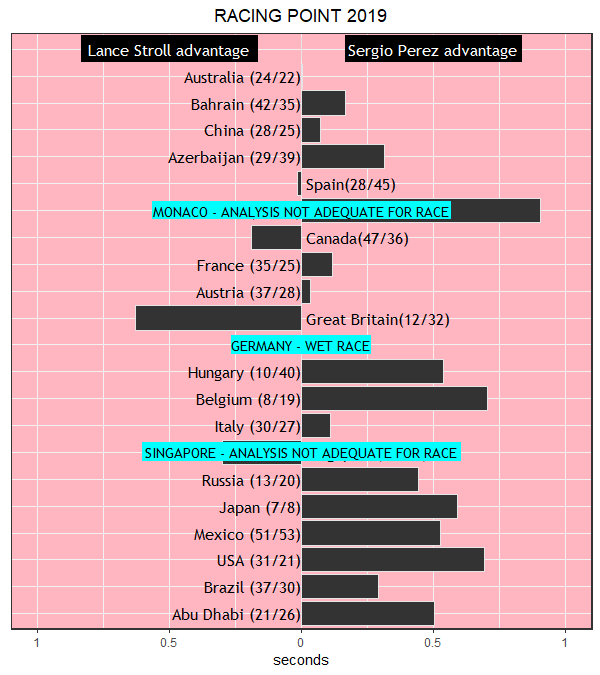
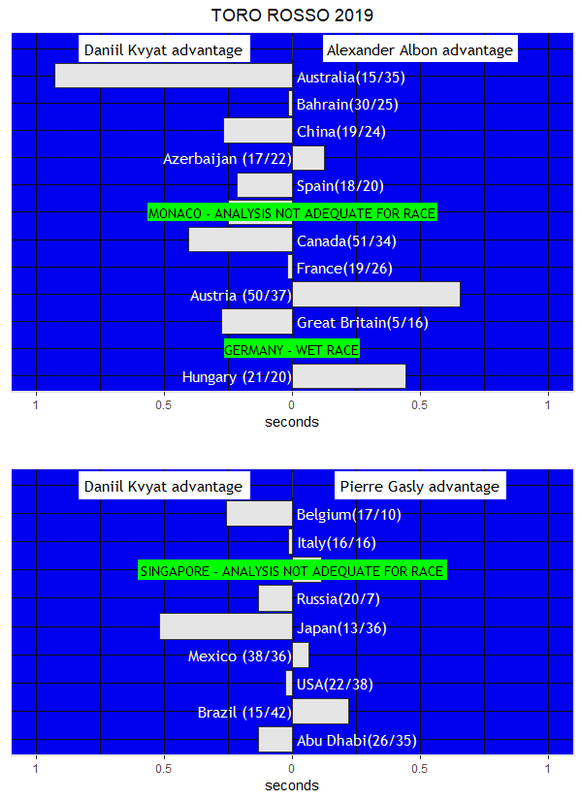
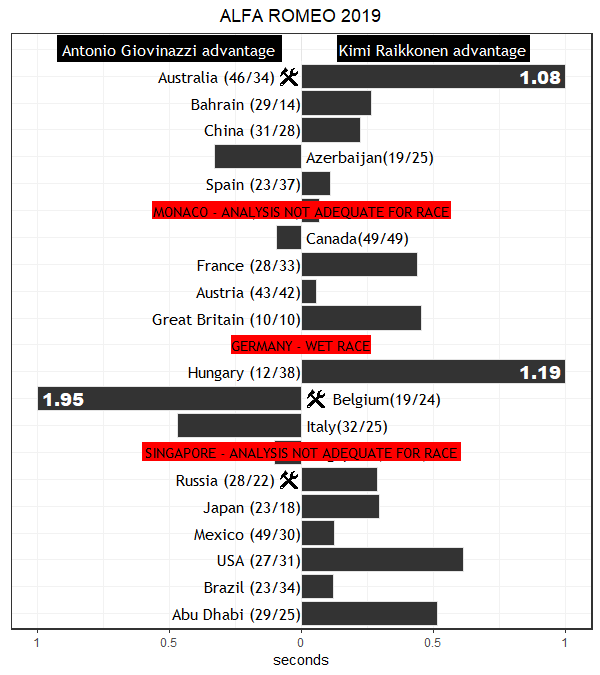
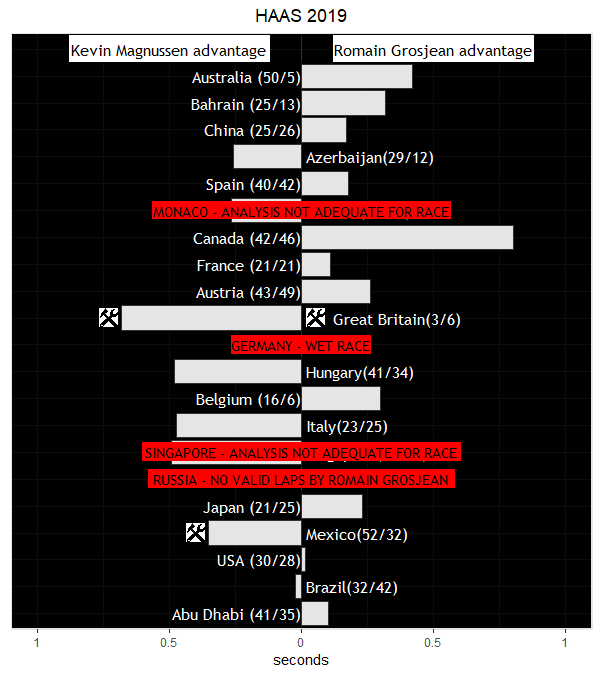
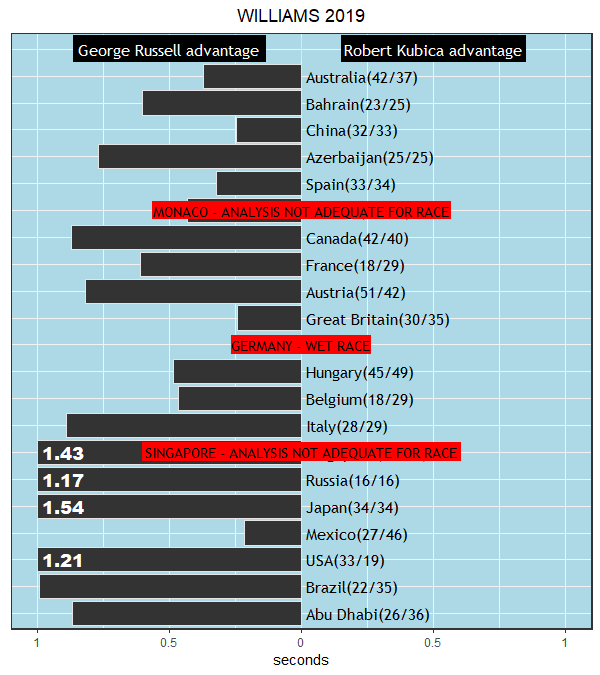
Also, here are the team mate comparisons:


(EDIT: removed to avoid thread clutter: see later posts for updated versions of the team mate comparisons)


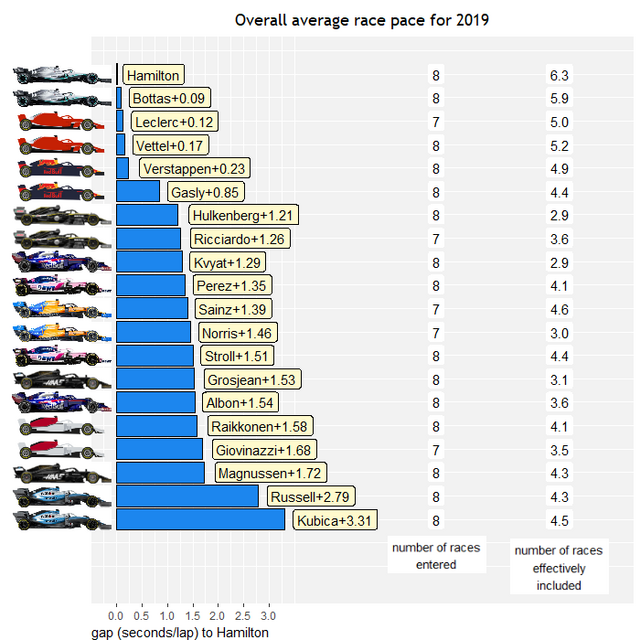
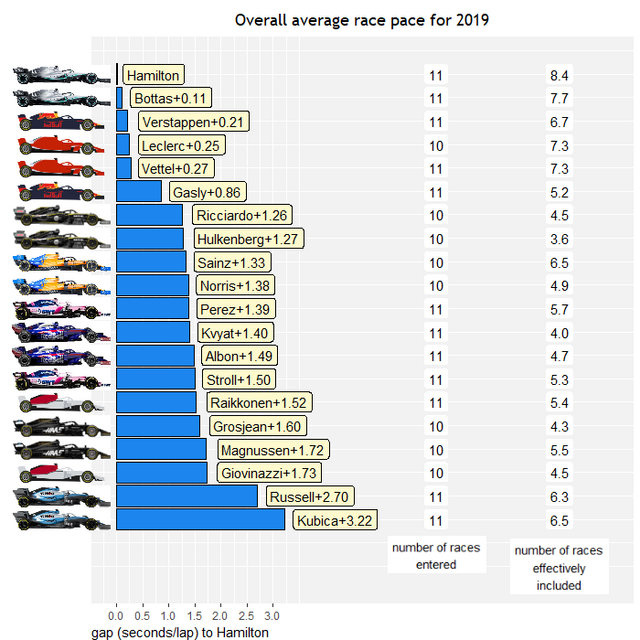
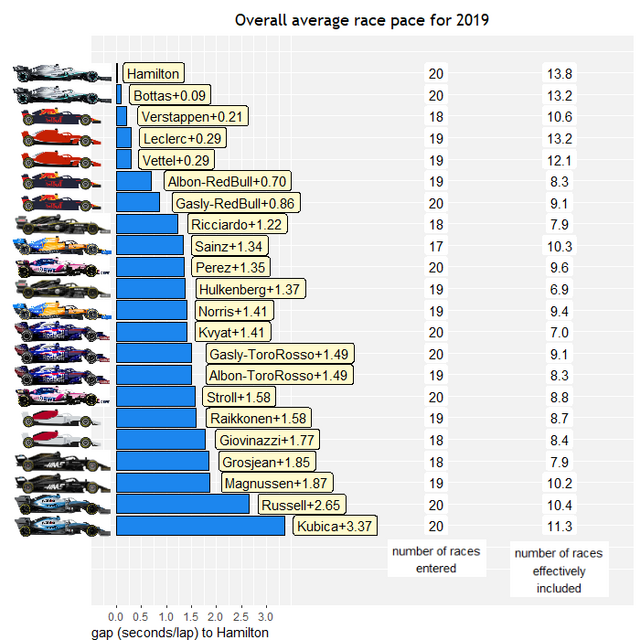
Here is the overall average for the season so far:
 

2019-yearly-pace.png


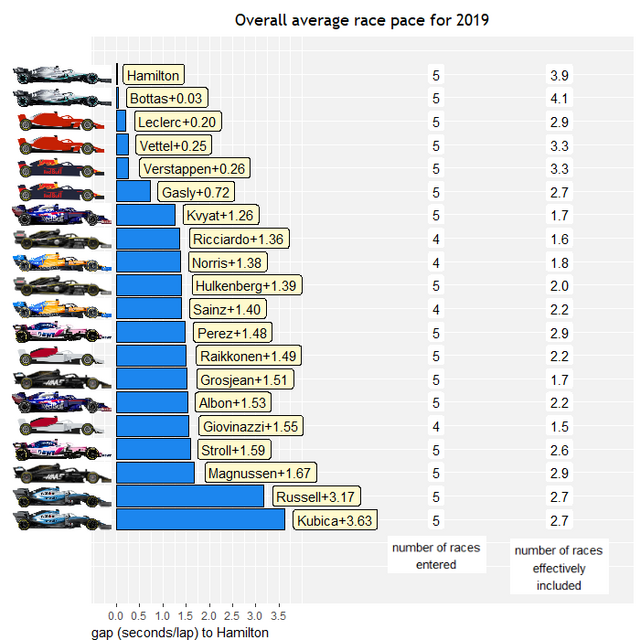
Don't think there can be too many arguments with which team heads the field. The big surprise has been Haas's slow race pace, although they did recover nicely in Spain. Gasly seems to be destined to have a lot of very lonely races this season, while Kvyat is currently the leader of 'Formula 1.5' but I expect the order of that battle will change frequently throughout the season given how close it is. Albon's average is a bit dubious, it's dragged down a lot by his race in Australia, which was a lot slower than Kvyat but is not representative of his pace in general.

As before, all comments and questions are welcome, although I might not be able to reply quite as quickly this year as in the past. I probably won't be able to update after every race this year for that matter, but everything should appear at some point throughout the year :)


Edited by moreland, 26 June 2019 - 09:42.


Advertisement

#2 f1paul

f1paul
  • Member

  • 8,276 posts
  • Joined: April 16

Posted 15 May 2019 - 19:01

Glad you can still do these Moreland, even if it's only every few races.  :up:


#3 FullOppositeLock

FullOppositeLock
  • Member

  • 10,993 posts
  • Joined: September 15

Posted 15 May 2019 - 19:49

Excellent work moreland, and many thanks for all the effort put into this analysis.

Your model must have a flaw somewhere though because for some odd reason it’s not showing that Renault’s race pace is much quicker than other midfield cars (just kidding in reference to a lenghty discussion earlier today in the Renault car thread ;))

#4 Requiem84

Requiem84
  • Member

  • 15,798 posts
  • Joined: September 10

Posted 15 May 2019 - 20:20

Great stuff! Very much appreciated!!

#5 sgtkate

sgtkate
  • Member

  • 5,614 posts
  • Joined: May 17

Posted 15 May 2019 - 21:53

This is really interesting. Thank you.
Funny how Azerbaijan seems to be an outlier circuit. A lot of 'underdog' team mates beat the 'faster' team mate there, 4 teams. I wonder why?

#6 coppilcus

coppilcus
  • Member

  • 2,009 posts
  • Joined: November 12

Posted 16 May 2019 - 07:02

Thank you!

#7 Maxioos

Maxioos
  • Member

  • 4,062 posts
  • Joined: October 17

Posted 16 May 2019 - 07:29

Thanks.


I struggle to understand why Vettel would have had better race pace than Max last GP as in Bahrein where he finished 30 seconds behind Max. If you have a pitstop extra, 2 stints on C3 against 2 stints on C2, it's not a surprise you have higher race pace seems to me.


#8 sgtkate

sgtkate
  • Member

  • 5,614 posts
  • Joined: May 17

Posted 16 May 2019 - 10:01

Thanks.


I struggle to understand why Vettel would have had better race pace than Max last GP as in Bahrein where he finished 30 seconds behind Max. If you have a pitstop extra, 2 stints on C3 against 2 stints on C2, it's not a surprise you have higher race pace seems to me.

The aim of the stats and calculations is to try to remove that affect on the data. In theory it shouldn't matter if a driver took 4 pits stop or 1 or had different tyres as this should get normalised out. I can imagine that is INCREDIBLY hard to do though.


#9 sopa

sopa
  • Member

  • 12,230 posts
  • Joined: April 07

Posted 16 May 2019 - 10:19

Kvyat has on average the 7th best race pace this season? A shocker.


#10 Otaku

Otaku
  • Member

  • 1,715 posts
  • Joined: March 11

Posted 16 May 2019 - 16:24

Nice to see Ferrari and Red Bull so close. Kvyat is impressive, they should switch him with Gasly.


#11 moreland

moreland
  • Member

  • 182 posts
  • Joined: July 17

Posted 17 May 2019 - 08:05

Excellent work moreland, and many thanks for all the effort put into this analysis.

Your model must have a flaw somewhere though because for some odd reason it’s not showing that Renault’s race pace is much quicker than other midfield cars (just kidding in reference to a lenghty discussion earlier today in the Renault car thread ;))


Thanks! To be fair, Renault have been hard to assess this year, their pace seems to be quite up and down and they're struggling to put clean weekends together, a bit like Toro Rosso for much of last year.


This is really interesting. Thank you.
Funny how Azerbaijan seems to be an outlier circuit. A lot of 'underdog' team mates beat the 'faster' team mate there, 4 teams. I wonder why?


I noticed that too, the formbook went out of the window generally there, with eg Perez being so quick and Hulkenberg being so far back. One theory I have is that there was only one tyre that was at all competitive in Baku (which was the C3/soft) and it had low deg, so how fast a team was came down to how well they could make that tyre work for the entire race.


Thanks.


I struggle to understand why Vettel would have had better race pace than Max last GP as in Bahrein where he finished 30 seconds behind Max. If you have a pitstop extra, 2 stints on C3 against 2 stints on C2, it's not a surprise you have higher race pace seems to me.


In Bahrain Vettel lost a lot of time with a spin which required a pitstop for a new nosecone so lost a huge amount of time there. Here are Verstappen and Vettel's lap times in Spain:


svettel-mverstappen.png


It's the second stint that drags Verstappen down a little, to be fair he's comfortable at this stage of the race and has no need to go any faster. But when you factor in his tyre and fuel his pace was about 0.5 seconds/lap slower than his pace in stints 1 and 3.


The aim of the stats and calculations is to try to remove that affect on the data. In theory it shouldn't matter if a driver took 4 pits stop or 1 or had different tyres as this should get normalised out. I can imagine that is INCREDIBLY hard to do though.


Yes, you're right, the model tries to factor in what the effect of tyre strategy was and adjust for it when producing the outright pace estimates. With the different strategies, and drivers having phases of pushing and easing off, being stuck behind other drivers etc, I agree the reality is more complicated than what my model adjusts for. So in some situations the estimate will be a bit out for certain drivers in certain races but over the course of the season it should balance out. I would argue it is much better in this respect than the points table, for example, in 2018, Ricciardo retired from 8 races. For those 8 races, the points table awarded Ricciardo the same score as the slowest driver in the field. My rankings never do anything as wrong as that 8 times to the same driver in a single season!


Kvyat has on average the 7th best race pace this season? A shocker.


That's all about consistency, the midfield is tight and his slowest performances haven't been too slow, unlike most of his rivals.


Looking at the estimates for each race you might expect Sainz to be a bit higher in the overall average and it's worth explaining why he isn't. He doesn't have an estimate for the Australian GP and has been awarded a 'phantom' slow rating for it. The reason is, I don't want the average to be affected by which races a driver did or didn't get an estimate for, so when a driver doesn't get an estimate for a race, I make a guess about what their estimate would have been, then include it in the average. Norris has been slightly faster on average, so my best guess for how fast Sainz would have been in Australia is that he'd have been slightly slower than Norris. This then drags down Sainz's estimate (and likewise, Norris gets a phantom fast rating for the Chinese GP, which he didn't get an estimate for, and this helps his overall average). That might sound a bit weird and complicated, but I think it needs to be done, otherwise a driver can be flattered compared to their team mate by missing the races where their car wasn't competitive. This happened in 2017 when Button only did the Monaco GP, which was clearly Mclaren's best track, therefore (before doing this fix) he was rated as the fastest Mclaren driver in 2017 which made no sense (especially given that Vandoorne was in fact rated as faster than Button at Monaco). Hope that all makes sense... :stoned:


Edited by moreland, 17 May 2019 - 08:07.


#12 moreland

moreland
  • Member

  • 182 posts
  • Joined: July 17

Posted 26 June 2019 - 09:41

It's time for the latest race pace updates for this season. Since the previous update there have been three races, the first of which was Monaco. I decided last year that my model wasn't suitable for the way the 2018 Monaco Grand Prix panned out - you may recall that the race was won by Ricciardo, driving a damaged car at a reduced pace with a train of cars behind him, with nobody attempting to get close enough to attempt to overtake. This year was a pretty similar story, with Hamilton having a train of cars behind him for most of the race. Further down the field it was a similar story with Stroll/Raikkonen/Sainz/Ricciardo having queues of cars behind them for extended periods. I think the assumptions that my model makes don't really hold for the Monaco Grand Prix, in particular the assumption that a driver is driving as fast as possible if they're >1.5 seconds behind the car ahead. Although the ratings don't look as strange as they did last year, I also don't think they can be properly trusted, so I've decided to exclude it from the yearly average pace calculations and have shaded over it in the team mate comparisons. For what it's worth, here are my estimates:

2019monaco-Race-Pace.png


Next we have Canada:
 

2019canada-Race-Pace.png


Hamilton, Vettel and Leclerc finished within seconds of each other so it's not surprising they are ranked almost equally. The Renaults and Stroll had impressive looking races and this is borne out in the rankings. This was the only race so far where a Williams has been ranked faster than a non-Williams, with Magnussen's pace being absolutely shocking. I've read through the comments and can't find any suggestion of a genuine technical issue that warrants discounting it, so it will have quite a big effect on the overall average for the season.

Finally, here are the rankings for last Sunday's 'classic' in France:
 

2019france-Race-Pace.png


Nothing too surprising here, although it's interesting to note how much better the Racing Points are on race pace compared to their qualifying pace. The Mclaren's race pace is also maybe a little disappointing bearing in mind they genuinely outqualified Vettel and Gasly (NB I excluded Norris's last 5 laps due to his steering problem). I commented after the Spanish Grand Prix that Haas might have fixed their race pace issues but I clearly spoke too soon, with both cars being firmly at the bottom of the midfield group. Gasly and Giovinazzi both made it into Q3 but did not fare so well in the race. Their strategy of starting on softs probably didn't help, since it was not a popular tyre:
 

stint-summary.png


However, their pace after that was also lacking, here is Verstappen versus Gasly:
 

mverstappen-pgasly.png


And here is Giovinazzi versus Raikkonen:
 

kraikkonen-agiovinazzi.png


Here is the overall average pace so far this season, with, as I mentioned above, Monaco excluded:
 

2019-yearly-pace.png


While here are the team mate comparisons:
 

[edit: removed to avoid thread clutter, scroll down for the latest updates]


I should hopefully be able to provide the updates following the races more regularly from now on. I haven't brought up as many themes/talking points following the races as in previous years and I expect this will continue to be the case. It's partly a case of time available, but I've got to admit that it's also a bit of a struggle to think of talking points this year! Judging by the other threads in the forum, it seems I'm not alone in feeling this...


Edited by moreland, 09 August 2019 - 10:54.


#13 statman

statman
  • Member

  • 7,312 posts
  • Joined: December 15

Posted 26 June 2019 - 09:58

yikes those Verstappen-Gasly differences are like Russell-Kubica.


Dr Marko will not be happy looking at his data


#14 SenorSjon

SenorSjon
  • Member

  • 17,613 posts
  • Joined: March 12

Posted 26 June 2019 - 14:37

Why were so many Gasly laps excluded?


#15 moreland

moreland
  • Member

  • 182 posts
  • Joined: July 17

Posted 28 June 2019 - 09:01

Why were so many Gasly laps excluded?


Hi SenorSjon, if you look at the Verstappen/Gasly lap time plot, a lot of Gasly's laps from lap 20-40 have been excluded due to being in traffic. He was close behind Ricciardo and then Raikkonen in this period. They eventually pulled out a bit of a gap on him, to the point that he was running in free air after that so his laps times are then included from about lap 40 onwards.


#16 SenorSjon

SenorSjon
  • Member

  • 17,613 posts
  • Joined: March 12

Posted 28 June 2019 - 11:46

I tend to believe they dragged Gasly forward.  :rotfl:


#17 moreland

moreland
  • Member

  • 182 posts
  • Joined: July 17

Posted 09 August 2019 - 10:53

So it's been a few races since the last update, in fact since I last posted we've had the 'awesome foursome' of races at Austria, Great Britain, Germany and Hungary. We've only got race pace ratings for three of them because with Germany being on a wet or drying track for the entire race, the assumptions of the model do not apply at all. So, here are the Austrian ratings:
2019austria-Race-Pace.png


As we can see, the strategies were quite similar:
stint-summary.png
Overtaking was also fairly easy so drivers all had plenty of clear laps so set representative times. Verstappen won having ended the first lap in 7th place, so unsurprisingly he has the fastest rating. Vettel's pace suggests he could surely have been a victory contender if he'd had a clean Q3 though. Further down the field, there was a quietly impressive drive from Albon on his way to 15th place. He was on the same strategy as Perez, who finished 11th, but we can see why Albon has been awarded a faster pace estimate:
aalbon-sperez.png


Here are the ratings for Great Britain:
2019greatbritain-Race-Pace.png

So it's basically a dead heat between Hamilton and Bottas. This might seem a little surprising given that Hamilton was able to follow Bottas so easily until the first pit stops. It's a little complicated to compare them because they followed different strategies:
stint-summary.png

They set very similar lap times after their pit stops. Overall the medium that Bottas was using was estimated to be a little slower when new, but had less degradation, than the hard that Hamilton was using so they are overall estimated as very similar, however Hamilton did ease up after Bottas made his final stop, which might have lowered his pace estimate slightly.


vbottas-lhamilton.png

The big surprise in this list is Stroll. Unlike Albon's estimate in Austria, this is one that I would say is debatable. He was stuck in traffic for the entire first two stints, as were many of the midfield runners such as the Renaults, Raikkonen and Albon. Once he was in free air after his late stop, he was about 1 second a lap faster than those drivers for the final 13 lap of the race. He had fresher tyres than them of course, but given the tyres had low degradation, he gets a lot of credit by the model for doing that.

As mentioned, we skip over Germany and move on to Hungary:

2019hungary-Race-Pace.png


Here are the strategies used:
stint-summary.png
Hamilton is naturally ranked as the fastest driver although the margin is quite small. For the first stint he was generally running around 2 seconds behind Verstappen so was considered to be running in clear air, so he and Max are ranked roughly equally for this phase of the race. After the stops, Hamilton looked faster but couldn't show it with lap times in clear air because he was so close to Verstappen until the second stop. It's only after that stop that he gets credited with fast lap times, but they're counterbalanced by his 'equal pace' lap times in the first stint, hence the small overall estimated advantage.

Further down we see Albon being ranked best of the rest despite finishing 10th, above even Carlos Sainz, who finished 5th. Their lap times look fairly similar in the second stint when in clear air, but Albon edges it due to Sainz having a few slightly slower laps towards the end of the race.
csainz-aalbon.png


A quick shout out to Russell, who managed to be rated faster than a non-Williams, if only by 0.01 seconds/lap. It isn't the first time this year actually, because he was faster than Magnussen's strangely slow pace in Canada. I was wondering if Williams are gradually closing the gap to the front of the field this year so here is the gap between Russell and the fastest driver in each race:

race             gapToFastest

2019australia         3.335  
2019bahrain           2.938  
2019china             3.349  
2019azerbaijan        3.628  
2019spain             3.41000
2019monaco            2.24000
2019canada            2.269  
2019france            3.073  
2019austria           2.00100
2019greatbritain      3.176  
2019hungary           2.78200

I would say they're closing a bit. Great Britain is a long track which distorts things a little, but it seems like 3 second gaps are possibly becoming the exception rather than the rule.

So,  here is the overall average for the year:
2019-yearly-pace.png


It's interesting to compare this to last year's plot:
2018-yearly-pace.png


Last year's best-of-the-rest winner was Hulkenberg, who was 1.5 seconds slower than Hamilton. This year, all the Renault, Mclaren, Toro Rosso and Racing Point drivers are faster than that, so the midfield is actually closer to the front, even if it might not feel like it.

Finally here are the team mate comparisons:

EDIT: removed to avoid cluttering the thread, latest update further down


Edited by moreland, 02 October 2019 - 12:00.


#18 Retrofly

Retrofly
  • Member

  • 4,608 posts
  • Joined: July 13

Posted 09 August 2019 - 11:55

Gap between Max and Gasley is shocking, such a shame Ric still isn't in the car, RB would be doing so much better.


#19 FullOppositeLock

FullOppositeLock
  • Member

  • 10,993 posts
  • Joined: September 15

Posted 09 August 2019 - 12:04

Excellent work as ever moreland, much appreciated!

Advertisement

#20 Tsarwash

Tsarwash
  • Member

  • 13,725 posts
  • Joined: August 10

Posted 09 August 2019 - 13:26

Excellent Analysis. Autosport ought to be paying you and putting this on their actual site. (Hint hint.)


#21 Requiem84

Requiem84
  • Member

  • 15,798 posts
  • Joined: September 10

Posted 09 August 2019 - 14:02

Interesting to see that the whole midfield got a lot closer to the top 3. 


Thanks Moreland, this is problaby my favorite data analysis on F1, and it surely is a lot better than what Gary Anderson sometimes is providing with his 'super times'! :)


#22 moreland

moreland
  • Member

  • 182 posts
  • Joined: July 17

Posted 02 October 2019 - 12:00

The latest set of race pace estimates are ready. Here is Belgium firstly:
 

2019belgium-Race-Pace.png

Hamilton and Leclerc crossed the line about 1 second apart, following a similar strategy. But while Leclerc had a clear track almost entirely throughout the race, Hamilton lost time behind Vettel both in the early phase of the race and after the pitstop, so Hamilton ends up with the better race pace estimate.

The midfield was again close pacewise. Here are the strategies:
stint-summary.png

Norris ran in a comfortable 5th place throughout the race so you might have expected his rating to be a little higher than his fellow midfielders. However many of his rivals were disadvantaged by being stuck behind Magnussen, who qualified 7th but was off the pace, early in the race. There were quite a few different strategies but the midfield sorted itself into approximate pace order by the end of the race.

The big exception was Ricciardo, who only finished 13th despite having upper midfield pace. This is partly because he had to pit at the end of lap 1 but Renault's strategy of not pitting again after that was surely a mistake. He was only 4 seconds behind Giovinazzi when Giovinazzi pitted, so could have been running a few seconds behind him at the end if he'd also pitted, but Ricciardo stayed out on his mediums and instead was almost 20 seconds and 4 places behind Giovinazzi at the point when Giovinazzi crashed.

I was interested to see how Albon did in this race but unfortunately it was a little inconclusive. He was overall almost a second off the pace, which doesn't sound too good but Spa is a long lap. We didn't see Verstappen race but he actually qualified more than a second behind Leclerc, although only 4 tenths slower than the Mercedes.

Next, here are the Italian ratings:
 

2019italy-Race-Pace.png


So Verstappen came 8th but is rated as the fastest driver. He effectively started his race 40 seconds behind everyone else due to his first lap incident and if we compare his lap times to Leclerc's, while it was clearly a race heavily disrupted by traffic, the laps we did see were fast:
 

mverstappen-cleclerc.png


The Hamilton-Bottas comparison might be a little surprising. Given Bottas started behind Hamilton and finished ahead of him, it's probably fair that Bottas has the higher rating but 4 tenths in his favour is a bit of a stretch. In reality Hamilton only had 8 laps included and 4 of those were towards the end of his 2nd stint when he had nothing race for. I'd say it's not one of the model's more reliable estimations.

The Ricciardo/Hulkenberg comparison is interesting, with Hulkenberg emerging ahead despite it looking like a race where Riccardo had him covered. This a bit of a tricky one. The lap times show a clear pattern and based on those, the model's estimates look reasonable:
 

dricciardo-nhulkenberg.png


However, Ricciardo was under no threat from other cars during the second half of the race while Hulkenberg had to keep up the pace to protect himself from Albon and potentially Verstappen later on. It's hard to know what the right thing to do is here, should Riccardo's lap times be ignored in this case? It might seem like they should be, but then if his lap times had been faster than Hulkenberg's anyway despite being under no threat, should they still be ignored? It doesn't feel like it's done the right thing here but fixing it could be complicated and cause other problems.

We next move on to Singapore, where I'm not going to say too much:
 

2019singapore-Race-Pace.png


This race was little like Monaco, with drivers driving well below the pace they were capable of, but unable to overtake. It's very hard to pick out which laps were genuinely reflective of the car's pace so I think the safest thing to do here is put it on the list of races that aren't suitable for the sort of analysis I do, so like Monaco it's excluded from the yearly average calculations and the team mate comparisons.

Finally, here are the Russian ratings:
 

2019russia-Race-Pace.png

I won't say too much about this race, but fortunately in this case that's because everything about the numbers look good. The ratings are similar to the finishing order, although a few drivers such as the Mercedes, Magnussen and Albon got lucky with the VSC while Norris, Perez and Hulkenberg were the big losers. Here are the strategies involved, the green hatched bit indicates when the VSC/safety car was out and we can see that the losers were the ones who pitted shortly before it. There are other drivers besides those I've mentioned who were affected but as it happened the impact on their strategy was smaller.


stint-summary.png

Here are the average race pace ratings for the year:
 

2019-yearly-pace.png


As far as the Gasly/Albon comparison is concerned, it couldn't really be much closer! I wouldn't read too much into that because it's early days and Albon in particular has not had many clean races. It's interesting that in the midfield, Racing Point have much faster race pace compared to qualifying pace while for Haas it's the other way around.

Here are the updated team mate comparisons:
 

mercedes-2019-30.png

ferrari-2019-30.png

redbull-2019-30.png

mclaren-2019-30.png

renault-2019-30.png

racingpoint-2019-30.png

alfaromeo-2019-30.png

tororosso-2019-30.png

haas-2019-30.png

williams-2019-30.png


Edited by moreland, 04 October 2019 - 09:41.


#23 Requiem84

Requiem84
  • Member

  • 15,798 posts
  • Joined: September 10

Posted 02 October 2019 - 12:05

Many thanks for your hard work!!


#24 SenorSjon

SenorSjon
  • Member

  • 17,613 posts
  • Joined: March 12

Posted 02 October 2019 - 12:26

Can you switch the sides in the RB/TR comparison. First the left is Verstappen/Kvyat, but it switches to the right in the comparison with the new teammate. 


But kudo's for you interesting work!


#25 Sterzo

Sterzo
  • Member

  • 5,057 posts
  • Joined: September 11

Posted 02 October 2019 - 16:37

I have now spent a significant part of my life studying your graphics, moreland, and it's been worth every minute. Thank you.


#26 moreland

moreland
  • Member

  • 182 posts
  • Joined: July 17

Posted 04 October 2019 - 09:47

Can you switch the sides in the RB/TR comparison. First the left is Verstappen/Kvyat, but it switches to the right in the comparison with the new teammate. 


But kudo's for you interesting work!


Thanks! Yes, that was a bit annoying, it was putting the alphabetical driver first, but that's fixed now.


I have now spent a significant part of my life studying your graphics, moreland, and it's been worth every minute. Thank you.


Cheers, I've spent a big chunk of time learning how to make them, don't like to think how much but it's a handy skill to acquire (I use the R programming language along with the ggplot2 package for the graphics, if anyone's interested) so time well spent I reckon. :)


#27 gowebber

gowebber
  • Member

  • 7,217 posts
  • Joined: May 08

Posted 05 October 2019 - 04:13


The Ricciardo/Hulkenberg comparison is interesting, with Hulkenberg emerging ahead despite it looking like a race where Riccardo had him covered. This a bit of a tricky one. The lap times show a clear pattern and based on those, the model's estimates look reasonable:
 

dricciardo-nhulkenberg.png


However, Ricciardo was under no threat from other cars during the second half of the race while Hulkenberg had to keep up the pace to protect himself from Albon and potentially Verstappen later on. It's hard to know what the right thing to do is here, should Riccardo's lap times be ignored in this case? It might seem like they should be, but then if his lap times had been faster than Hulkenberg's anyway despite being under no threat, should they still be ignored? It doesn't feel like it's done the right thing here but fixing it could be complicated and cause other problems.

We next move on to Singapore, where I'm not going to say too much:


renault-2019-30.png


Nice work, alot of data there. The Renault Italy one I don't think you could call in favour of Hulkenberg though. Ricciardo was clearly cruising the in second part of the race while Hulkenberg was driving flat out to hold onto his place. This was evidenced by Dan being able to pull out much faster laps at will during that period, also the team mentioned he didn't need to drive flat out at that time too. Ricciardo was ahead by 2-3 tenths all weekend pretty much over Hulk. Any doubt should really be in Dans favour there not the other way around.


Also in Russia and Australia for example Dan's race pace was heavily compromised by car damage from lap 1 incidents and Hulk had engine issues at Hungary, so not really a fair comparisons there and distorts the overall gap so far this year. If you exclude those (not adequate amount of comparison data) and fix the Italy one Dan clearly has a decent race pace advantage so far this year.


Edited by gowebber, 05 October 2019 - 04:28.


#28 moreland

moreland
  • Member

  • 182 posts
  • Joined: July 17

Posted 04 December 2019 - 10:11

So we'll now look at the final set of race pace ratings for the 2019 season. There are a few to get through so I'll spread them and the final rankings over the next few days. Here is Japan:
 

2019japan-Race-Pace.png


Bottas won the race but Hamilton had an 8 second lead with 10 laps to go only to be brought into the pits. A comparison of Hamilton and Bottas's lap times reveal why Hamilton has the faster race pace rating:
 

lhamilton-vbottas.png


Vettel has been rated as 0.5 seconds/lap faster than Leclerc in this race. This is a little dubious, if you look at their lap times here:
 

cleclerc-svettel.png


You will notice that all of Leclerc's included lap times have come a little later in his stint, having spent the earlier laps in the stint recovering from his early pitstop after colliding with Verstappen on lap 1. My model takes into account the age of the tyres when considering drivers' pace, but it doesn't adjust for what drivers had been doing on their tyres as they age. In Vettel's case it was running in clear air, in Leclerc's case it was following and overtaking other cars which, we often hear, damages the tyres.

We next move on to Mexico:
 

2019mexico-Race-Pace.png


There were a variety of tyre strategies being used in this race, here is a quick reminder:
 

stint-summary.png

The drivers finished in the order Hamilton/Vettel/Bottas/Leclerc so it might seem a little surprising that Bottas is ranked as the fastest of the four drivers. The reason for this is that Bottas only actually finished only 3.5 seconds off the lead having been 11 seconds off the lead after 6 laps. He ran an almost identical strategy to Vettel but gained almost 10 seconds on Vettel while in clean air, so this all makes sense I think.

What is more doubtful is the Verstappen/Albon comparison. Verstappen did almost the entire race on a single set of hards. This means we firstly have the same issue as we had comparing Vettel and Leclerc in Japan, that Verstappen spent a lot of laps following and overtaking drivers while Albon had clear air throughout:
 

mverstappen-aalbon.png


Also, while I take into account how old tyres are, I don't take into account how long drivers are planning to use their tyres for. So it seems likely that Verstappen was driving conservatively early in the race knowing he had to make the tyres last the entire distance.

The finishing order (on the road) outside the top six was Perez/Ricciardo/Kvyat/Gasly and their pace is similar even though they started in the order Kvyat/Gasly/Perez/Ricciardo. I think this is a good example of how the tyre rules about starting the race on the tyres used in Q2 do not work, they just penalise the midfielders for qualifying well. I believe this rule is to change in 2020 though. Mclaren also started in the top 10 but finished well down, in their case they just lacked pace however.

USA, Brazil and Abu Dhabi to follow tomorrow...


#29 moreland

moreland
  • Member

  • 182 posts
  • Joined: July 17

Posted 05 December 2019 - 11:40

Nice work, alot of data there. The Renault Italy one I don't think you could call in favour of Hulkenberg though. Ricciardo was clearly cruising the in second part of the race while Hulkenberg was driving flat out to hold onto his place. This was evidenced by Dan being able to pull out much faster laps at will during that period, also the team mentioned he didn't need to drive flat out at that time too. Ricciardo was ahead by 2-3 tenths all weekend pretty much over Hulk. Any doubt should really be in Dans favour there not the other way around.


Also in Russia and Australia for example Dan's race pace was heavily compromised by car damage from lap 1 incidents and Hulk had engine issues at Hungary, so not really a fair comparisons there and distorts the overall gap so far this year. If you exclude those (not adequate amount of comparison data) and fix the Italy one Dan clearly has a decent race pace advantage so far this year.


Sorry, didn't notice this til now! I agree about Monza, when there was something at stake Ricciardo was faster. I do have something lined up that should better deal with situations like that, hopefully over the winter I'll be able to address it in a later post.


Anyway, let's step through the last races. Here we have the US Grand Prix rankings:


2019usa-Race-Pace.png

Bottas narrowly beat Hamilton in this race, with Verstappen also finishing within 5 seconds of Bottas. Bottas and Verstappen both ran two stop strategies, Hamilton only did one stop and all things considered Hamilton comes out marginally ahead. It was an unusual race in that all three tyres were widely used:
 

stint-summary.png


This race was a fairly straightforward one, with cars freely overtaking and you can see in the 'number of laps included' column that the drivers managed to get plenty of clear laps to show their pace. The midfield battle was interesting in that around lap 40, half the drivers decided to stay out while half gambled on stopping again. The net difference to their positions was minor, with only Raikkonen losing out but that was mainly due to a lack of pace compared to the rest of the midfield.

Finally, I've marked Albon as driving a damaged car even though he recovered from last at the start of lap 2 to 5th place. These decisions are always a bit subjective, his pace compared to Verstappen and the rest of the frontrunners was as it usually is, but it looked like a fairly heavy knock and he and the team both mentioned floor damage so I've recorded it as a damaged car.

We next look at Brazil:
 

2019brazil-Race-Pace.png

This will be remembered as a crazy race, but it was fairly normal and straightforward for about 50 laps, so most drivers' race pace is judged on the race until then. There are a few surprises to me in the rankings, for example it felt like a comfortable win for Verstappen, in particular because he overtook Hamilton straight away, twice, during the race. On the other hand he was never more than 2 seconds ahead of Hamilton until the safety car appeared, so their pace can only be judge to be similar.

Sainz worked his way up from last on the grid to 3rd place by the end, yet he seemed to do with average pace. I would stand by this, if you look at his pace in clear air compared to drivers on similar strategies. For example, here are his lap times next to Raikkonen's:
csainz-kraikkonen.png


Sainz's pace was similar to Raikkonen's in the first stint, and was similar despite having fresher tyres in the second stint.

There was a big gap between the Renault drivers on pace, which is unusual, with Ricciardo winning the midfield pace race comfortably, while Hulkenberg was invisible in the race. They weren't often on the same tyres at the same time, but Ricciardo's lap times certainly look a lot quicker:


dricciardo-nhulkenberg.png


Finally, we look at the Abu Dhabi results:
 

2019abudhabi-Race-Pace.png


Hamilton and Bottas ranked about equal, with the obvious caveat that Hamilton had a comfortable lead throughout the race while Bottas was chasing cars right until the end.

Ricciardo ends the season with a thumping 'Formula 1.5' victory, however he spent almost the entire race stuck in traffic, his rating is calculated purely on a few clear laps following a late stop at the end of the race, so it's not to be taken too seriously. The big surprise to me here was the relatively low rankings of the Mclarens. But dig into the lap times and it's easy to see why, here are Norris's lap times against Kvyat's:
 

lnorris-dkvyat.png


In the second stint Norris is substantially slower despite having fresher tyres.

So that wraps up the race reports for this year. I'll produce the final installment for this season over the weekend, with the updated team mate comparisons, the final average pace ranking for the year, plus a few reflections and thoughts about future plans.


#30 moreland

moreland
  • Member

  • 182 posts
  • Joined: July 17

Posted 07 December 2019 - 10:19

So here are the final team mate comparisons:
 

mercedes-2019-30.png

ferrari-2019-30.png

redbull-2019-30.png

renault-2019-30.png

mclaren-2019-30.png

racingpoint-2019-30.png

tororosso-2019-30.png

alfaromeo-2019-30.png

haas-2019-30.png

williams-2019-30.png

A few interesting trends here. The difference between Hamilton and Bottas is rarely large, but the way Hamilton so consistently has the small edge is remarkable. At Renault we can see the advantage steadily swing towards Ricciardo as the season progresses. Likewise, as Racing Point improved, Perez built up a very solid advantage over Stroll in the second half of the season. At Alfa Romeo, there were echoes of the Raikkonen/Grosjean at Lotus, with Giovinazzi, like Grosjean, regularly outqualifying Raikkonen but Raikkonen generally having the upper hand in the races.

Meanwhile, here is the overall average race pace for the season:
2019-yearly-pace.png

So once again we see the division between the big three teams and the rest, although it's a little less noticeable on the graph compared to last year, partly because the 2nd Red Bull is halfway between the two groups, but also, the midfield actually gained about three tenths over the frontrunners this season. Here is last year's plot for comparison:


2018-yearly-pace.png


The big winners are clearly Mclaren, gaining about 4 tenths compared to last year (despite arguably losing some lap time by swapping Alonso with Sainz and Norris). The losers are clearly Ferrari, losing about 3 tenths, and Haas, losing about 0.25 seconds/lap, which was particularly painful given that the midfield generally gained on the frontrunners.

So, that wraps things up for this season. I've been less active than in the previous couple of seasons and I'm wondering if I've said most of what there is to say concerning how the model treats the lap times. The race reports I have done this year seem to be repeating a lot of the themes from previous reports, it's just the names of the drivers change from race to race. I'd say the main things it doesn't handle so well are

  • when a driver has nothing to play for and backs off
  • when a driver is doing a long stint, it might not make enough of an allowance for them driving to conserve their tyres
  • if a driver spends a lot of time following and overtaking cars, we often hear that it harms the tyres and I don't take account of that
  • if a driver is within 1.5 seconds of the driver in front, I exclude the lap time, otherwise I include it. It feels like a bit of an abrupt cutoff and there are some rare occasions where a driver would actually be rated faster if their excluded lap times had been included.
  • if a driver has been involved in a collision, do you or don't you exclude their lap times from the analysis?

But as I've said before, individual races will always have some unreliable estimates but I think the pattern over the whole season can be trusted e.g do any of the team mate comparison plots fail the 'eye test'? I don't think so. So I think it probably makes sense to focus more on trends over the season next year rather than give detailed explanations for every race. I probably don't need to be saying the same kind of things again 22 times next year!

What I will do during the offseason is start a new thread, open to suggestions but I was thinking of calling it something like 'the number crunching, graphs and analysis thread'. I'll do regular updates on the trends for the season so far, like the ones I've featured in this post, but I've also got a few ideas for analysis and graphs not directly related to f1 race pace that I might want to display when they're ready. I think that might be a more interesting (and convenient!) plan from now on :)


#31 ElectricBoogie

ElectricBoogie
  • Member

  • 733 posts
  • Joined: March 19

Posted 07 December 2019 - 10:43

Great work, thanks!

Curious to see that KVY-GAS works out differently than it seemed to me.


#32 Krumbukt

Krumbukt
  • New Member

  • 6 posts
  • Joined: December 17

Posted 11 December 2019 - 19:23

thnks for yet another year of this excellent analysis. i oddly enough find this more interesting than many of the races :stoned: hopefully we'll see a change to that in 2021 but in the meantime i hope you'll keep this up!  :clap: