Jump to content


Photo
- - - - -

Consistency Indexes


  • Please log in to reply
21 replies to this topic

#1 Dratini

Dratini
  • Member

  • 2,536 posts
  • Joined: July 17

Posted 08 August 2019 - 12:40

Hi guys and girls..

I was doing some thinking last night regarding consistency levels of the drivers, mainly that of Verstappen and Hamilton. My observation through these forums and social media has been that generally the consensus points to Max as being the more consistent driver over the 2019 season thus far. However, we typically just point to this race and that race etc, to try and make our case. From this I remembered an article I read about cricket, where the writer had used mean and standard deviation to calculate a consistency index (CI); a metric which was used to measure how consistently a batsman performs relative to their average. I tried to draw up these same calculations for the 20 Formula One drivers so far in the 2019 season (it's not perfect!)

Basically, I used the finishing positions of all the drivers to determine their average for the season, but omitted races where drivers weren't classified. So for example, Germany wasn't included in my calculation for Bottas given he wasn't classified, however Sainz' 19th in Bahrain was, as he was classified despite not finishing the Grand Prix. The following are my findings:


5mrcag.jpg


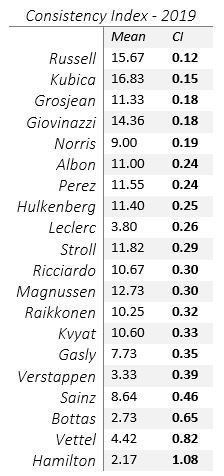
As can be seen, I've ordered drivers from most to least inconsistent, where the closer to 0.00 a CI is, the more consistent the driver is considered to be. I admit that I was quite surprised that this metric points to Hamilton as being the most consistent of the lot, but we are all quite aware there are some variables at play. So before getting into that, it's worth pointing out that there are some more definitive cases in the table.

Evidently one's CI will be affected by their mean finishing position; the Williams drivers are a good example of this. The car is rubbish, and thus it is difficult to finish higher up the field than they have done, hence the standard deviation (the difference between any given finishing position, and the mean) will be minimal, creating a low CI. However, if we look at the table from a team-by-team basis, we can determine that a driver who has both a higher mean finishing position and a lower CI is in fact having the better season. This applies to four drivers in Russell, Grosjean, Perez and Leclerc, who all are not only finishing on average higher up the order than their teammate, but also doing so with greater consistency. Things become murky for the remainder of the teams, where one driver will tout a higher average finishing position, but also a higher CI. Are there any sound conclusions we can draw from the six teams that remain?

McLaren and Red Bull provide the two best examples where we can draw conclusions by interpreting the data objectively. At McLaren, Norris' CI is 0.19, compared to 0.46 for Sainz. The young Englishman has a bit of a consistency advantage over Sainz (perhaps owing to the aforementioned Bahrain classification), while Sainz just pips him in mean finishing position; scoring 8.64 to Norris' 9.00. We may conclude that Norris is effectively having the better season, given how marginal the difference in average finishing position is.

Further, in the case of Red Bull, Max' mean finishing position of 3.33 (amusing number, considering) bests Gasly's of 7.73, considerably. Meanwhile, the CI for each is split by just 0.04 in favour of Gasly. It is very easy to conclude that Max is having the better season, and is more consistently yielding strong results (we didn't need the data for this).

But what about Renault, Toro Rosso, Alfa and Mercedes? What of their numbers? I'm curious to see how other posters interpret this data. The analysis is fairly new to me, so perhaps questions need to be asked to just how consistent a CI of 0.12 is, and how inconsistent is 1.08? Let's see what people can come up with, shall we? :) (thanks for reading, I've been at the pub)


Advertisement

#2 Clatter

Clatter
  • Member

  • 44,747 posts
  • Joined: February 00

Posted 08 August 2019 - 13:02

What is your definition of consistency? It seems rather confusing when you omit things like Bottas spinning out in Germany. If crashing your car doesn't count against you, then what does?

#3 NixxxoN

NixxxoN
  • Member

  • 4,149 posts
  • Joined: June 17

Posted 08 August 2019 - 13:05

No clue how this works. Grosjean is supposed to be 3rd most consistent even though he's been inconsistent as hell and his last results are 10th, 14th, 16th and 7th?
And Hamtilon's got 1st or 2nd for all races except two, he's the most inconsistent by far?

Sorry I dont think this makes any sense

#4 Lephturn

Lephturn
  • Member

  • 131 posts
  • Joined: June 01

Posted 08 August 2019 - 13:20

Consistency is not important when you are consistently at the back.


If you want that to be meaningful you have to exclude outliers in a different way - Hamilton being at the bottom of that list shows that your current method renders the calculation meaningless.


Average finishing position is far more meaningful.


#5 monolulu

monolulu
  • Member

  • 3,129 posts
  • Joined: March 10

Posted 08 August 2019 - 13:24

No clue how this works. Grosjean is supposed to be 3rd most consistent even though he's been inconsistent as hell and his last results are 10th, 14th, 16th and 7th?And Hamtilon's got 1st or 2nd for all races except two, he's the most inconsistent by far?Sorry I dont think this makes any sense


Think table is the other way round - most consistent at the bottom!

#6 noikeee

noikeee
  • Member

  • 23,220 posts
  • Joined: February 06

Posted 08 August 2019 - 13:45

I'm very confused. I think you managed to create a meaningless statistic and take bad conclusions from it. Consistency in race finishing positions means very little IMO:

- if you have a top car and have 1 or 2 races where everything goes wrong, not even necessarily due to your own fault, you'll tank that consistency index very quick - see Hamilton's, who's had a great season, yet has a poor index due to 1 very bad race in Germany. However if you're in a Williams, have one very bad race, and finish 5 laps back... It doesn't even register, you'd finish last anyway

- this statistic gives better numbers to drivers who retire a lot over those who limp to the finishing line. See Grosjean

- this statistic fails to take into account that some cars have lots more direct competiton than others therefore one slightly bad race will immediately put them many places back. Whereas others will finish around the same place whatever happens

#7 Dratini

Dratini
  • Member

  • 2,536 posts
  • Joined: July 17

Posted 08 August 2019 - 13:50

What is your definition of consistency? It seems rather confusing when you omit things like Bottas spinning out in Germany. If crashing your car doesn't count against you, then what does?

Ah, refer to my very last line. Querying whether it would be worth including retirements is something I meant to add but forgot.


No clue how this works. Grosjean is supposed to be 3rd most consistent even though he's been inconsistent as hell and his last results are 10th, 14th, 16th and 7th?
And Hamtilon's got 1st or 2nd for all races except two, he's the most inconsistent by far?

Sorry I dont think this makes any sense

The CI is to refer to the consistency of the average finishing position. If Grosjean's average finishing position is 11.33 then he has a standard deviation of 2.04 and you divide the latter by the former. It's important to evaluate the way that you perceive consistency. Do you look at it as merely performing consistently to the mean, or rather the continued consistent performance of a high level? That Grosjean finished 10th, 14th, 16th and 7th is of little substance.


Consistency is not important when you are consistently at the back.


If you want that to be meaningful you have to exclude outliers in a different way - Hamilton being at the bottom of that list shows that your current method renders the calculation meaningless.


Average finishing position is far more meaningful.

Outliers can't be excluded. The CI is calculated from the mean, and excluding data means you don't have a mean, you just have a series of cherry-picked numbers.


Think table is the other way round - most consistent at the bottom!

Unfortunately, Hamilton and others who race at the front are affected more heavily by poor races. Given that the standard deviation is divided by mean, a lower mean will always yield a higher value. In some ways you can interpret the table as being roughly the opposite of the standings. This is because when one of the front-running drivers has a bad weekend, there is more room to fall back than there are for those whose mean already presides within that range.


#8 Jazza

Jazza
  • Member

  • 1,827 posts
  • Joined: November 99

Posted 08 August 2019 - 13:52

Surely the system can’t work because a driver’s finishing position is determined more by other drivers than their own performance?

In cricket you go out and hit 45 runs one game, 41 the next, 52 the one after, etc. In this you are somewhat in control of your own performance and there is something that can be measured. But with Motorsport, whether you finish 5th or 15th has less to do with you and more to do with how many cars in front had problems.

That list almost looks like reverse championship standings! That there shows that there must be a flaw in the system.

#9 Dratini

Dratini
  • Member

  • 2,536 posts
  • Joined: July 17

Posted 08 August 2019 - 13:56

Surely the system can’t work because a driver’s finishing position is determined more by other drivers than their own performance?

In cricket you go out and hit 45 runs one game, 41 the next, 52 the one after, etc. In this you are somewhat in control of your own performance and there is something that can be measured. But with Motorsport, whether you finish 5th or 15th has less to do with you and more to do with how many cars in front had problems.

That list almost looks like reverse championship standings! That there shows that there must be a flaw in the system.

I tend to agree, but it's my first thread so I must defend it to the death!


#10 Tsarwash

Tsarwash
  • Member

  • 13,725 posts
  • Joined: August 10

Posted 08 August 2019 - 14:17

I tend to agree, but it's my first thread so I must defend it to the death!

What do you want to be written on your headstone ? Something profound, or something witty ? 


#11 Sterzo

Sterzo
  • Member

  • 5,073 posts
  • Joined: September 11

Posted 08 August 2019 - 14:34

Consistency by itself means nothing. Consistently quick, yes, but you could achieve consistency by driving a second off your natural pace and thereby avoiding errors. This index doesn't measure driver consistency anyway - positions are determined by car/driver combinations.


I hope Grosjean has found this thread, though. He'll be telling Gunter Steiner how consistent he is when flying-off-the-road moments are discounted.


Edited by Sterzo, 08 August 2019 - 21:19.


#12 Anderis

Anderis
  • Member

  • 7,405 posts
  • Joined: December 09

Posted 08 August 2019 - 14:42

I don't think you can measure consistency in such a circumstancial sport as racing, even more so if it's not a single-spec racing series. All it takes is a car to have performance fluctuations over a season and it will lead to conclusions that a driver performed inconsistently.


#13 Tsarwash

Tsarwash
  • Member

  • 13,725 posts
  • Joined: August 10

Posted 08 August 2019 - 14:49

I simply do not understand how this is done. If you look at Hulkenberg's results compared to Giovinazzi's, the Hulk is all over the place whereas Giovinazzi is pretty consistently finishing around about 14th, 15th. So how can they be similar in your calculations ? Hulk's mean is 11.4 according to you and yet he has had only two races where he finished close to this, some good results and some bad ones. 


#14 Grayson

Grayson
  • Autosport digital product manager

  • 3,497 posts
  • Joined: July 08

Posted 08 August 2019 - 15:06

I think the biggest problem with any discussion of consistency is the difference between the "real" definition of consistency and the way that we use it in normal English.


When someone says, "x driver is very consistent" or "y driver had a very consistent season", what they really mean is that that driver usually manages to perform well and that they rarely have an off weekend. Someone who responds by pointing out that that driver actually had a couple of absolutely superb 10/10 weekends as a counterargument would be seen as somewhere between pedantic and obtuse.


If someone's driving extremely badly and crashing out or coming last every week then no normal person is referring to them as "consistent" even though it would be accurate.


Similarly, if a driver who usually wins Class B has a lucky weekend where there are lots of retirements and they manage to win a race, it would be misleading to use that as evidence of their inconsistency.


There's also a problem with trying to compare consistency at different levels of finishing position. The way that this looks like it's being calculated, mathematical consistency is much harder when your finishing positions are very high. If your average position is 2nd and you get a 1st and a 3rd, you're only one position out each time and that looks pretty consistent. But that's 50% away from your mean each week and would harm your consistency index in the same way as a driver who usually comes 10th finishing 5th one week and 15th the next. There's no granular position between 1st and 2nd so of course Hamilton, Bottas and Verstappen are going to be at the sharp end of a way of measuring consistency which treats 1st and 2nd as being as far apart as 10th and 20th!


#15 EggAndHam

EggAndHam
  • Member

  • 43 posts
  • Joined: May 13

Posted 08 August 2019 - 15:36

Finishing higher in the points is more difficult so should be rewarded more - so add weights to the finishing positions. Places won and lost from the qualifying position need to be considered. Starting at the back and consistently moving forward should be rewarded, as should maintaining a high points finish.

A non finish should also carry a heavy penalty. This would sort the Grosjean outlier out.

Factor those items in and you'll get closer.

I like that you're trying (and defending) this. We can all see your first attempt is flawed but it's an interesting endeavour. I'd like to see how you progress with it. 


#16 JRodrigues

JRodrigues
  • Member

  • 1,806 posts
  • Joined: September 11

Posted 08 August 2019 - 16:15

Finishing higher in the points is more difficult 


Not if you have a Mercedes/Red Bull/Ferrari.


#17 Tsarwash

Tsarwash
  • Member

  • 13,725 posts
  • Joined: August 10

Posted 08 August 2019 - 16:45

Not if you have a Mercedes/Red Bull/Ferrari.

Tell that to Gasly. 


#18 B38

B38
  • Member

  • 859 posts
  • Joined: May 16

Posted 08 August 2019 - 16:57

Tell that to Gasly. 

If you compare Gasly performance vs his teammate, he is very consistent. :wave:


#19 DrivenF1

DrivenF1
  • Member

  • 1,050 posts
  • Joined: March 11

Posted 08 August 2019 - 17:54

We can never do a meaningful comparison on consistency, except as a reference to a teammate. Alonso was super consistent when he beat Vandoorne (21-0) and their differences were quite regular. The teammate could destroy that consistency by being inconsistent, who do you blame then! Perez & Ocon both seemed very consistent, always close which was a massive indicator.

The true measure of consistency is compared to extracting the most out of the car (e.g. a certain percentage) however that is almost impossible for us to determine. The teams would have a better idea given simulations.

Edited by DrivenF1, 08 August 2019 - 17:57.


Advertisement

#20 PlatenGlass

PlatenGlass
  • Member

  • 4,704 posts
  • Joined: June 14

Posted 08 August 2019 - 22:01

If Grosjean's average finishing position is 11.33 then he has a standard deviation of 2.04 and you divide the latter by the former.

This is the key bit, and I don't think you mentioned it in your opening post. Why do you do it like this? This seems to be the exact reason why it looks like a reverse order of the championship standings.

#21 noikeee

noikeee
  • Member

  • 23,220 posts
  • Joined: February 06

Posted 08 August 2019 - 22:24

Also, what if the car itself is inconsistent and much more competitive in certain tracks than others...?

#22 JRodrigues

JRodrigues
  • Member

  • 1,806 posts
  • Joined: September 11

Posted 08 August 2019 - 23:05

If you compare Gasly performance vs his teammate, he is very consistent. :wave:


Yes. He's consistently terrible, but yet he's still in 6th place.