The "idling" energy that "reciprocates" between a car (or motorcycle) engine and the tranmission line may get, at high revs, by far larger than the useful energy from the combustion.
"Idling" in the meaning that "it is there", "it loads the parts", but it offers nothing useful.
The following is a "strictly technical" approach / analysis.
The horizontal axis is the crankshaft angle (zero degrees at the center of the axis, 360 degrees from left to right ends, 15 degrees per “division”(?) line):
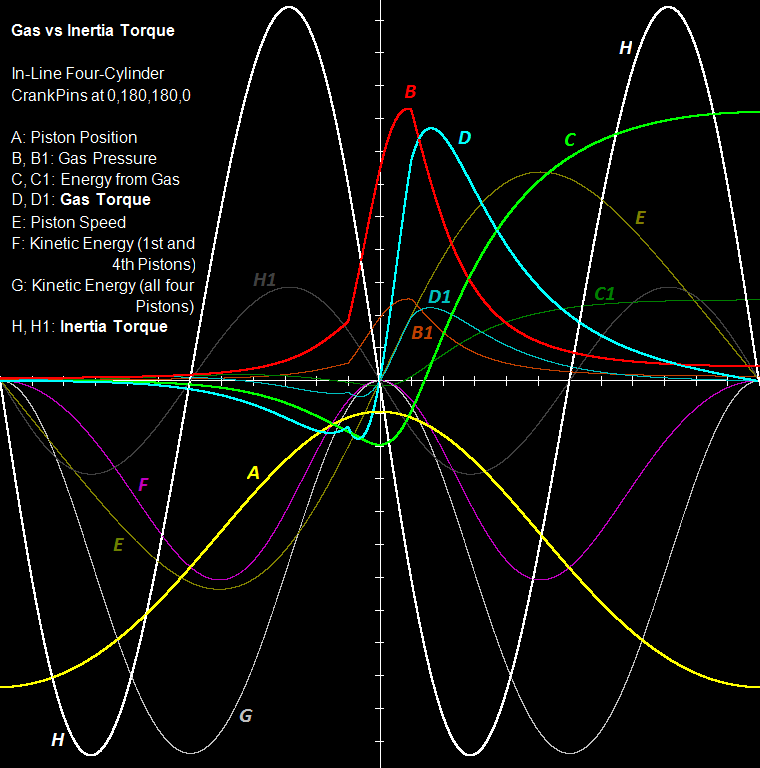
The curve A (yellow) is the displacement of a piston of a 4-in-line flat-crank even-firing engine.
At the left-most and the right-most points of the A curve, the piston is at its BDC; at the middle the piston is at its TDC (you can think the points on the yellow line as successive positions of the piston crown, with the horizontal axis being the “roof” of the cylinder).
The “height” of the dead volume is the distance of the apex of the curve A from the center of the horizontal axis.
So, the distance of each point of the A curve from the horizontal axis is linearly proportional to the volume of the working medium in the cylinder (it includes the dead volume).
Starting with the curve A (yellow) and supposing 1 bar initial pressure and adiabatic (isentropic) compression / expansion, the curve B (red) is made.
It is the pressure inside the cylinder.
The adiabatic compression ends 15 degrees before the TDC; then energy is progressively provided to the working medium (the compression / expansion continues) until 15 degrees after the TDC; then it starts (and completes) the adiabatic expansion.
The increase of the energy of the working medium from -15 to 15 crank degrees is such that the iMEP (Indicated Mean Effective Pressure) is 14 Bar (giving, at 7,000rpm, an indicated power of 190kW (~260bhp) and (if the overall friction losses are taken as 15%) an output power of 220bhp on the crankshaft.
With the curve B (red) and the displacement of the piston (curve A), the curve C (green) is made; it is the (accumulated) energy provided to the crankshaft by the working medium (air, or air-fuel mixture).
During the compression this energy is negative (because the working medium absorbs energy from the crankshaft).
The curve C intersects the horizontal axis at about 25 degrees after the TDC.
The derivative (with respect to the crank angle) of the curve C (with reference to the crankshaft angle) is the curve D (thick cyan). The curve D is the combustion torque provided to the crankshaft. Before the TDC this torque opposes to the rotation of the crankshaft (compression stroke).
The curves B1 (brown) and D1 (thin cyan) are the cylinder pressure and the combustion torque at partial load operation (~1/3 of the full load, in this case).
If the engine had weightless (zero mass) pistons and connecting rods, the analysis would end here.
The curve E (dark green) is the piston speed and is calculated from the curve A (yellow). The A gives the displacement of the piston. Dividing the displacement of the piston by the required time it results the speed.
The curve F (purple) is the energy take-and-give between the pair of the pistons that move according the curve E and the crankshaft (for instance: from 75 degrees before the TDC till the TDC the kinetic energy of the two phased piston decreases, which means the crankshaft / flywheel are pushed to rotate faster) .
The curve G (gray) is the total energy take-and-give between all the four pistons of the 4-in-line plane-crank even-firing engine and the crankshaft.
The curve H (white and thick) is the derivative (with respect to the crank angle) of the curve G. It is the torque provided to the crankshaft by the set of the four pistons due to the variation of their speed during the cycle (for constant angular velocity of the crankshaft / flywheel).
At, say, 30 degrees before the TDC, all the four pistons decelerate losing kinetic energy which is provided to the crankshaft/flywheel pushing them to rotate faster.
The curve H1 (dark gray) shows what the H curve but for half revs.
The data used for the above calculations / analysis are:
4-in-line plane-crank (crank pins at 0, 180, 180 and 0 degrees) 4-stroke engine.
Stroke: 84mm
Bore: 95mm
Connecting Rod length: 160mm (center-to-center)
Displacement: 2.4lit
Each piston assembly mass: 0.6Kg (piston, piston rings, piston pin, and ~1/3 of the connecting rod mass).
7,000rpm (and 3,500rpm)
At top revs (say 7,000rmp, giving a 19.6m/sec mean piston speed) the inertia torque (curve H) is far larger than the full throttle combustion torque (curve D).
The useful torque (i.e. the combustion torque) the engine transmits to the drive wheels is like “noise” inside the much larger “inertia torque”.
Note: while the combustion torque is – mainly – positive, the inertia torque is equally negative and positive; what counts is the difference (from the bottom to the top) of each curve. On this reasoning, the combustion torque D is two times smaller than theinertia torque H.
There are systems that smooth out the torque going to the transmission line.
The question is how much energy is wasted during this “smoothing”.
Looking at the amplitudes and shapes of the H (white) and D (cyan) curves, the “efficiency” of the smoothing is quite questionable.
Even if an engine is to be used a couple of times – during its service life – at the top revs, the transmission has to be able to operate reliably at these revs.
At medium revs (3,500 rpm) the inertia torque (H1 curve) and the combustion torque (D curve) are comparable and the engine runs nicely at heavy / medium loads.
However, at medium revs and light loads (which is the typical case: think of cruising at 75mph (120Km/h) on a flat road), the combustion torque drops and gets as, say, the D1 curve: the dominant torque that passes (actually reciprocates) to the transmission line is the inertia torque again.
While the combustion torque is – more or less – constant along the useful rev range, the inertia torque falls with revs squared. Below, say, 2,000 / 2,500rpm the dominant factor is the combustion torque.
Now suppose the PatVRA (https://www.pattakon...pattakonVRA.htm) is mounted between the crankshaft of the above engine and the transmission line.
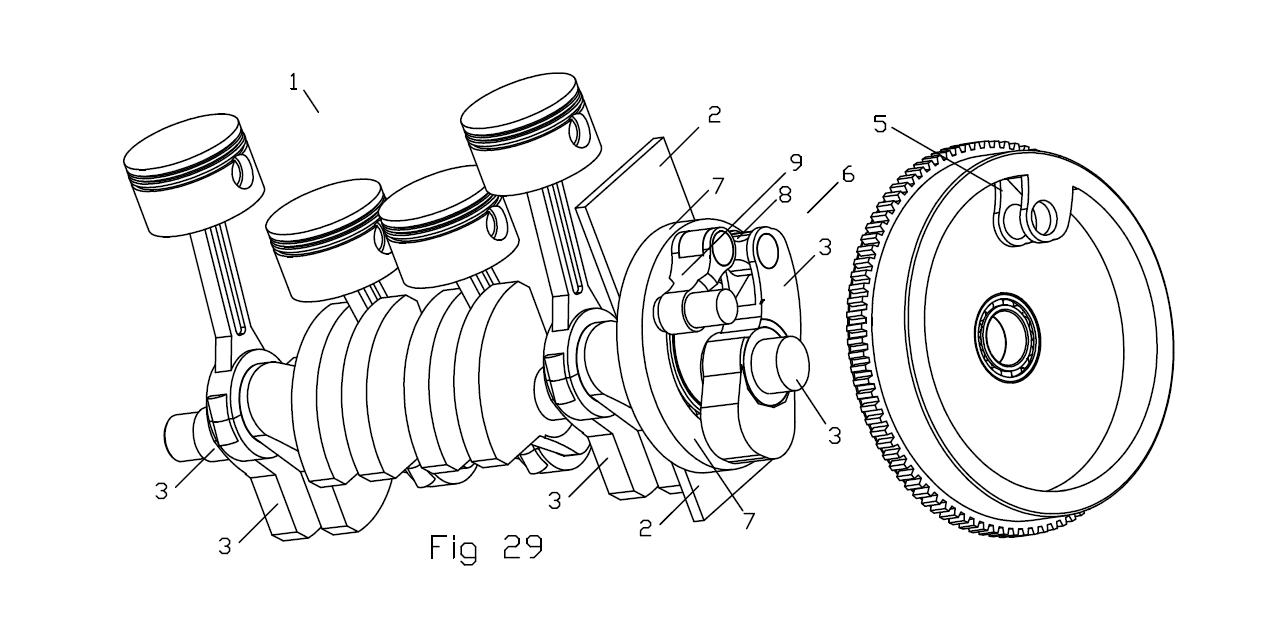
With the PatVRA only pure combustion torque is allowed to pass to the transmission line, either at low revs, or at medium revs, or at the rev limit of the engine.
Besides the noise reduction, the vibrations reduction and the better feeling, it is also the power / energy saving.
The PatVRA makes the typical four behave (as regards the inerti torque and the transmittion of the power to the drive wheels) as the Wankel Rotary, the V8 engines.
The cylinder head of a Honda Civic 1600cc / 16v / VTEC was modified to pattakon-roler VVA to breath more efficiently:
The mean piston speed at 9,000rpm: 23m/sec.
Imagine the amount of inertia torque reciprocating to and fro the transmission line.
With the PatVRA it would run more quietly, more efficiently, more reliably and with better feeling of the drive tires hooking with the road.
For typical cars the difference will be smaller, yet there are still significant advantages.
******************
The following plot shows the Fourier analysis of the Combustion Torque at full throttle (i.e. of the cyan thick curve).
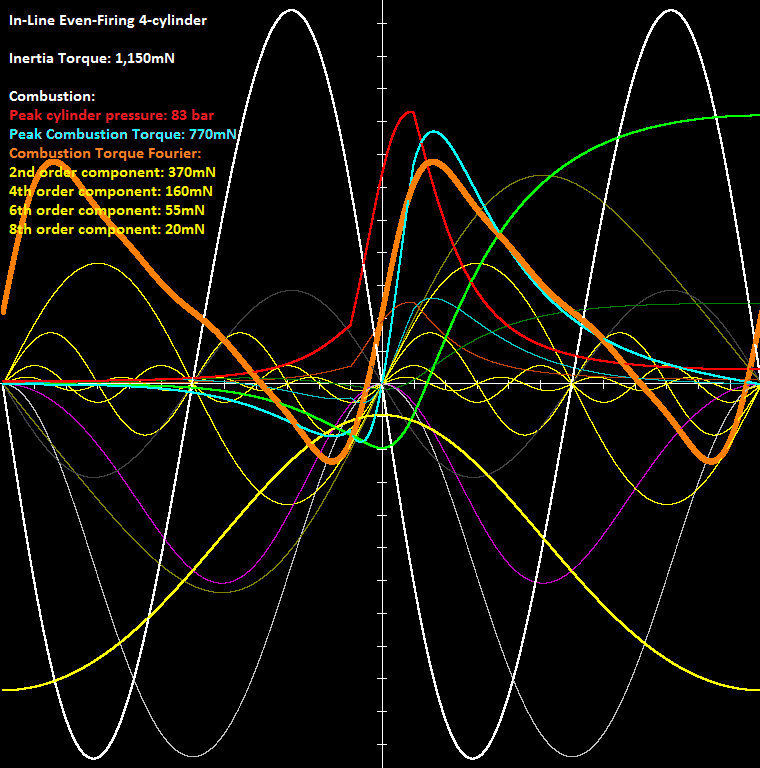
The yellow-thin curves are the 2nd, 4th, 6th and 8th order Fourier Components of the Combustion Torque.
The thick orange curve is the re-synthesis of the Combustion Torque from the above four Fourier components and is for the complete engine (while the cyan curve is for one only cylinder).
The peak cylinder pressure is 83bar (red curve).
The (second order) Inertia Torque is 3 times larger than the second order component of the Combustion Torque.
And this for full throttle.
At medium loads the relation gets "worse".
****************
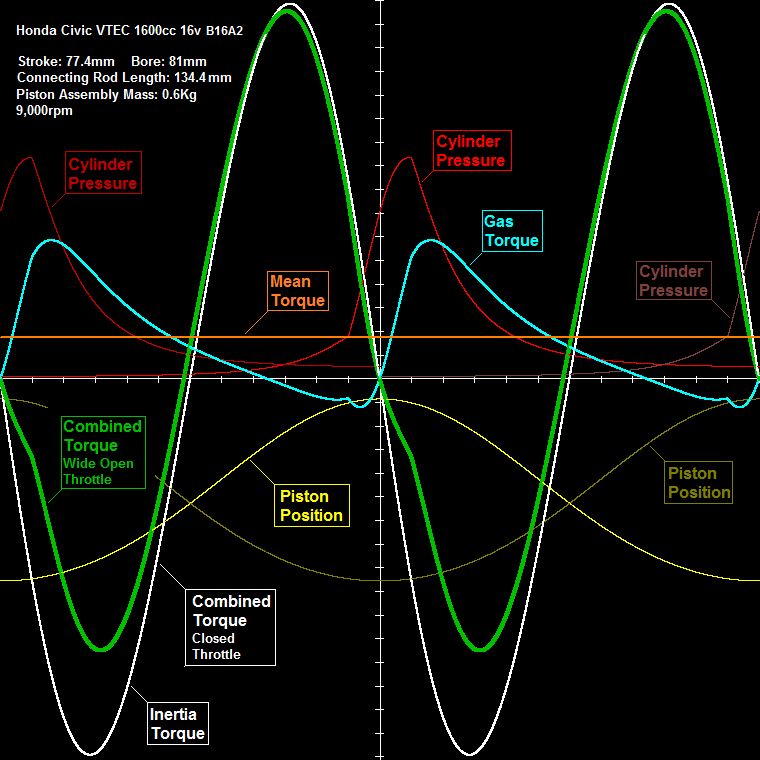
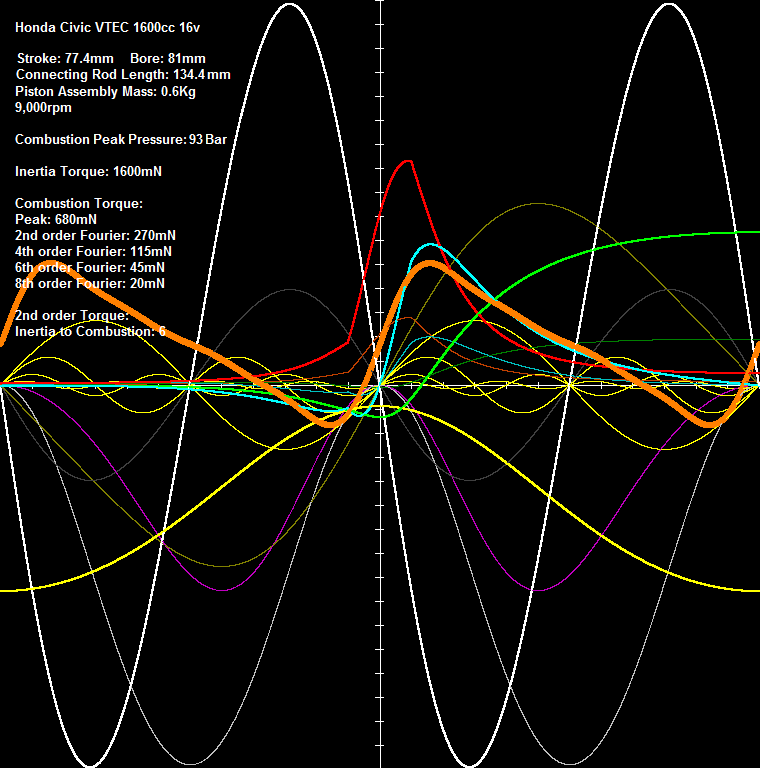
The following plot is for the Honda Civic 1600cc VTEC (B16A2 engine) of the video:
Measured Data:
Piston mass: 300gr
Piston pin mass: 100gr
Connecting rod mass: 600gr
I.e. reciprocating mass per cylinder: 300+100+(600/3) = 600gr = 0.6Kg
The Peak Pressure is increased at 93 Bar, giving an iMEP of 16.5Bar.
At 9,000rpm the Inertia Torque is six times larger than the 2nd order Fourier Component of the Combustion Torque (at full open throttle).
Note: the 2nd order Fourier Component of the Combustion Torque is the dominant component of the Combustion Torque (see the yellow thin curves).
Imagine the difference with the PatVRA system (for the driver / passengers, for the clutch, for the transmission, for the wheels etc) .
More about the PatVRA system at https://www.pattakon...pattakonVRA.htm and
Thanks
Manolis Pattakos