

Hi forum users, thought I'd start a new thread to devote to any bits of data analysis/interesting graphs etc that you might want to talk about related to motorsport. There is of course the 'crazy statistics' thread which is a lot of fun, but while that tends to look at interesting quirky statistics, I'm thinking that this thread could be more about trying to demonstrate or debate some sort of message behind the various numbers.
I'll set the ball rolling with a slightly different way of looking at race pace. In the past I've posted summaries after each race listing how fast I estimate each driver to have been. Here is the one for the 2019 season for example:
https://forums.autos...race-pace-2019/
The estimates were generally in the right ballpark I think, although there were examples of where it would misrank drivers in certain situations. Looking back, I think trying to rank every driver after every race and worrying about how accurate each one was missed the point a bit. As regular fans, we know that driver pace, and pace compared to your teammate for example, can vary from race to race. Whether a driver was three tenths or two tenths faster that another driver in a single race isn't normally too important. What is a lot more interesting is what the overall long term trend is. If you take e.g. ten races where team mates have had representative races, the variation from race to race has cancelled out to a large extent and we might have a large enough set of lap times to have a trustworthy comparison. That's the angle we take in this post.
We'll start off with an example from last season. We'll look at the Ferrari drivers.
In 2019, Leclerc completed 1156 laps, Vettel 1178. Some of these are obviously not representative, e.g laps behind the safety car, lap 1, safety car restart laps, inlaps, outlaps. Also, while racing laps on a wet or drying track are representative of course, they are unfortunately very complicated to analyse, so for now I discard them. After that filtering, that leaves us with 982 laps for Leclerc and 984 for Vettel.
However, we want to compare their lap times directly, so we will only look at the laps where both Leclerc and Vettel were on track at the same time. Reliability is good these days so luckily that leaves us with 862 laps that we can compare. When we do this, we find that on average Vettel is 0.119 seconds/lap faster in these laps.
However sometimes drivers obviously have a problem with their car, e.g. due to an earlier collision or a mechanical issue. It didn't affect the Ferrari drivers much this year but Leclerc had big engine problems towards the end of the race in Bahrain and did a few slow laps at the start of the Japanese Grand Prix with a damaged car. We don't want to include those lap times because they are not representative. That leaves 850 laps overall. Looking at those laps we find that Vettel is now 0.072 seconds/lap faster.
We then need to make a big reduction though - it's not fair to compare their lap times when one driver is stuck in traffic while the other is in clear air. This culls quite a lot of laps. After filtering down to laps where both drivers are in clear air, we have 575 laps overall. Vettel's average lap time is 0.055 seconds/lap faster using these laps.
We next introduce a feature that I had on the backburner for a long time but never got around to introducing when I was doing the race by race analysis. It's common for a driver to have nothing to play for towards the end of a race. In that situation, a driver will tend to turn the engine down, take it easy on the brakes and tyres and make sure they bring the car home. We don't want to use these lap times when estimating the driver's representative pace. The question is, how can we tell that a driver is in this situation?
We can best illustrate the method with an example that happened in 2019 and was discussed a bit in the 2019 race pace thread. Here are Hulkenberg and Ricciardo's lap times in the Italian Grand Prix: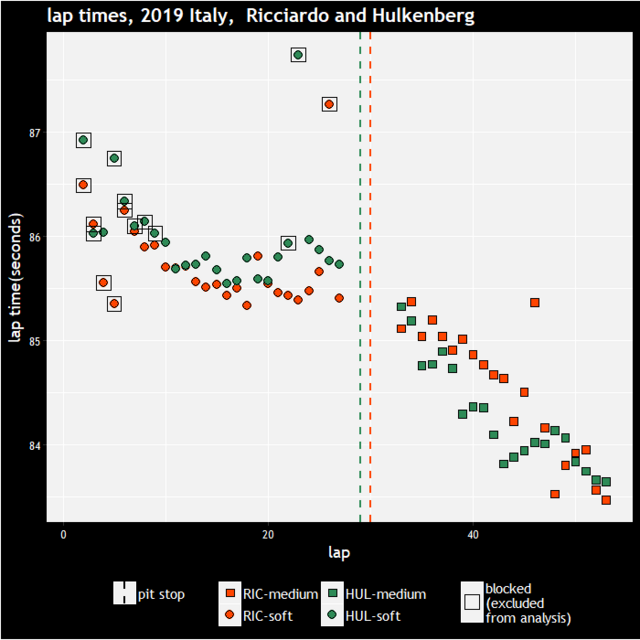
So we see Ricciardo having a solid advantage in the first stint, but after the pit stops, Hulkenberg is quicker. I estimated their race pace to be similar for the race.
However, in this next plot, I display the expected finishing position for each driver at each lap of the race. It does this by taking the positions and gaps of all drivers at the end of each lap, and then simulates the rest of the race. It uses a mixture of their qualifying pace and pace they have shown in the race to estimate how fast they will lap. It then has a basic model which estimates how long it will take them to overtake/get overtaken/remain stuck behind other cars (the overtaking model is quite interesting in its own right and I might talk about it in this thread one day).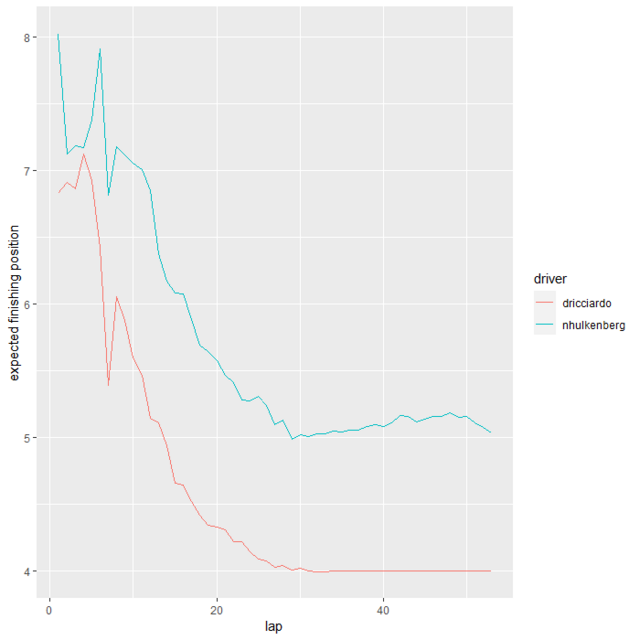
So we see that at the start of the race, Ricciardo is expected to finish in about 7th place, Hulkenberg about 8th (they started in 5th and 6th but were expected to get overtaken by Albon and Verstappen before the end of the race). In fact, their expected finishing positions improve soon, partly because Vettel had an accident and dropped to the back of the race, plus Verstappen lost time due to a lap 1 incident, and Albon also dropped back a bit in the early laps. So in the second half of the race, Ricciardo is expected to finish 4th, Hulkenberg is expected to finish 5th.
However, this next plot shows the probability that each driver will finish in their most likely expected position at each point of the race: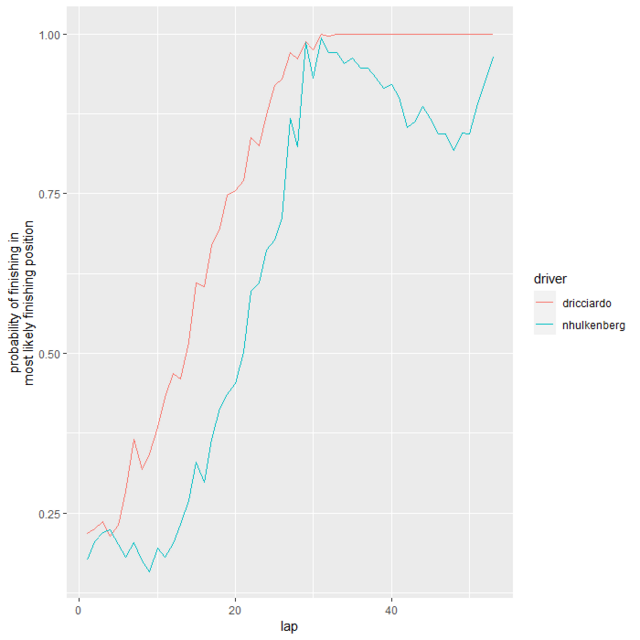
At the start of the race, these probabilities are low - which makes sense, we might predict that Ricciardo is most likely to finish about 5th e.g. but lots of things can still happen in the race, we don't know how it will pan out, he could easily not finish in 5th! But by lap 35, Ricciardo was in 4th, 22 seconds behind Bottas and 18 seconds ahead of Hulkenberg. It's highly unlikely that he will catch Bottas or get caught by Hulkenberg, so the simulations are effectively certain he will finish 4th. That's why we see a probability of 1 on the y-axis for him from lap 35 onwards.
As for Hulkenberg, things are a little more precarious. He was 11 seconds ahead of Albon, but Albon was catching and there were still 18 laps remaining. Hulkenberg is favourite to stay ahead but we can't be sure. By lap 45, he was only 4 seconds ahead. As a result, the simulations still think he's likely to hold on to 5th position but it's not certain - looking at the lower graph, it's only about 83% sure he'll finish in 5th.
So, overall we can say that from about lap 30 onwards, although Hulkenberg still had an incentive to push, Ricciardo did not. As a result, we shouldn't use these lap times when comparing his pace to Hulkenberg's.
So, back to Leclerc and Vettel: if we eliminate the laps where either driver had no incentive to push, we go from 575 available laps down to 390. Vettel's advantage now? 0.045.
So, I've displayed a few different ways of calculating the pace difference between the Ferrari drivers. You can debate which one you think is the most reliable, but in this particular case it doesn't make a massive difference which you choose, the answer comes out fairly similar in most cases, i.e. it's very close.
There's an important factor I've not talked about so far though - were the drivers always on a comparable strategy throughout these laps? What if Leclerc was using older tyres, or was on a worse tyre than Vettel during some of these laps? We would like to adjust for that if possible - it's what I did when I was estimating race pace. The way it works is, let's say Vettel set a lap time of e.g 1:20.1 and Leclerc set a lap time of 1:20.5. However, Leclerc's tyres were ten laps older and my calculations suggest that cost him 0.15 seconds/lap compared to Vettel. Instead of treating Vettel's lap as 0.4 seconds/lap faster, I treat it as 0.4 - 0.15 = 0.25 seconds/lap faster. There is an issue of how reliable that 0.15 number is. It's not an exact science but I would argue that even a basic estimate, as I've done, is better than doing nothing. But obviously you can decide for yourself if you want to use my adjusted numbers.
If you do, it's still close but Leclerc turns out to be marginally faster now, by 0.011 seconds/lap. As it happens, Leclerc's tyres were on average 14.43 laps old during those 390 laps we included, while Vettel's were on average 13.42 laps old during the same laps. So Leclerc had tyres that were on average one lap older, so it makes sense that we've adjusted the comparison slightly in his favour.
So these comparisons are a little different to the ones I did before, firstly, because they only take into account laps when both drivers were in the race at the same time. Secondly, because now you can see what the average lap times are when you just look at the raw lap times, as well as when you adjust for tyre type and age. When I presented the result previously, the tyre adjustments were made throughout, so it was hard to see just how big an impact they were having. Plus there is the new feature of removing laps where either driver had no incentive to push.
So, that's the method, now we want to look at some of the results. I found that looking at each driver historically was the most interesting way to look at these, so I think I'll present them in that way. I've got data going back to 2011, which means we've quite a lot of drivers to look through, so I'll release a few comparisons each day. I've roughly grouped drivers by team groups, and since we've discussed Vettel/Leclerc, I'll start with the Ferrari/Sauber/Alfa drivers.
Here are Vettel's comparisons versus his teammates: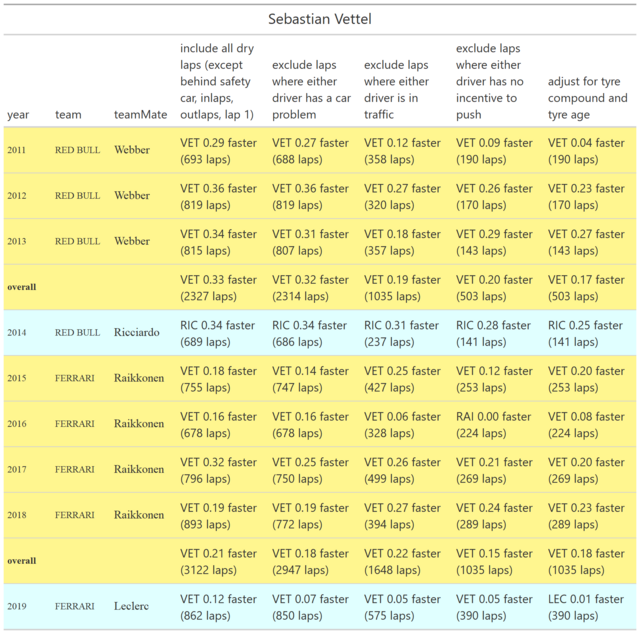
So he was faster than Webber every year. However, Ricciardo's advantage over him was quite decisive. Some say it was just a single bad year, but, as we see more comparisons, it's quite rare for a driver to be as far as 0.25 behind their team mate for a whole season and then be as quick or quicker than them in a different season. The Raikkonen comparison is clear cut, and we've already discussed Leclerc.
Next we'll look at Raikkonen:
From what I remember, Grosjean overall had a slightly better qualifying record, but Raikkonen had a clear edge in the races. As for his record compared to Alonso, let's just say I've got an opinion on some of Ferrari's driver choices over the years...
We've discussed Leclerc and we'll have another look at him via Ericsson: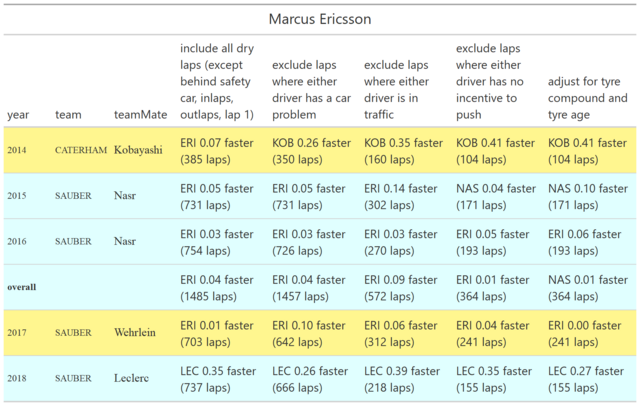
So a couple of effective dead-heats versus Nasr and Wehrlein, then a clear defeat to Leclerc and in fact an even bigger defeat to Kobayashi. Kobayashi better than Leclerc? Obviously there's an experience factor at play there but here is Kobayashi's data: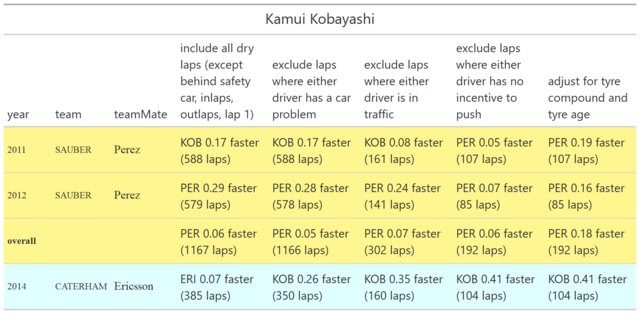
2011 is difficult to call but 2012 things swing in Perez's favour. What is odd is how few laps we end up using for both of those seasons.
That's a lot of the Ferrari/Sauber/Alfa drivers done, stay tuned tomorrow for the Force India/Renault/Haas drivers!


