Jump to content


Photo
* - - - - 1 votes

Mathematical Model to compare F1 drivers


  • Please log in to reply
68 replies to this topic

#1 F1Frog

F1Frog
  • Member

  • 654 posts
  • Joined: August 21

Posted 03 November 2023 - 13:21

I have started making a very simple mathematical model to compare Formula 1 drivers. My model is based on comparing the outright pace of the Formula 1 drivers to their teammates, then comparing them all through drivers with shared teammates. So far, I have created a model for the drivers from 2012-2022. I plan to extend this all the way back to 1950 eventually, although I think it probably isn’t massively useful for comparing drivers for different eras due to the fact that drivers are so much closer together nowadays than in the past. This is due to things like telemetry, simulators, data and training, rather than them actually being better drivers, so while Mike Hawthorn would probably be around 2% slower than Alberto Ascari or Juan Manuel Fangio, and Nikita Mazepin may be only 1.5% slower than Max Verstappen, that doesn’t mean that Mazepin is a better driver than Hawthorn, it just means he is closer to the ultimate pace of the car, which is easier to do in the modern era. I think it is more useful for comparing drivers of similar eras, but not to the extent that it can be taken as a fact, because it is also necessary to look at the context behind the results and explain why some drivers may be overrated or underrated by the model. The flaws in the model are obvious; driver level fluctuates year on year and while these fluctuations are limited by taking the average across all the seasons, there are still random surprise results which can skew the results for drivers with not many teammate connections. The notes will try to analyse this. Also, this does not include race pace at all, it is all about qualifying (with practice times used when there are no representative qualifying times for a driver).

Method

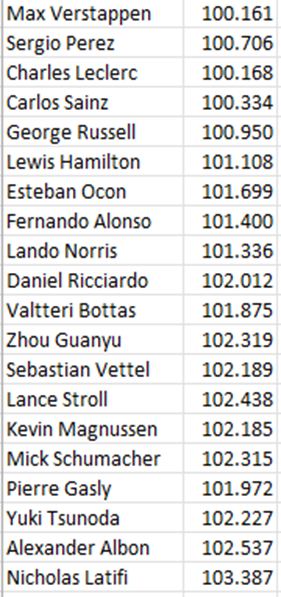
The first step is to find the ‘supertimes’ for every driver, for each season. This involves taking the fastest lap by each driver for each weekend and turning it into a percentage of the overall fastest lap of the weekend. Usually, this will be the qualifying laps but if a driver has an issue in qualifying, it goes back to their fastest practice time in order to reduce the effect of anomalous results in qualifying. Each driver than has a supertime for each weekend, with the driver with the fastest lap of the weekend having a score of 100, and then the supertimes for every weekend of the season are averaged to get an overall score for the season for every driver/car combination. Some years, I had to calculate this myself, and other years Autosport was kind enough to do it for me. These are the overall supertimes for the 2022 season, for example:

image.png?w=281

The next step in the process is to put these results into the mathematical model. Every driver starts with a base score of 100. Then in the next column, for Max Verstappen for example, I would put Sergio Perez’s score in column 1 (100), add his score for 2022, then take away Perez’s score for 2022. I do this for every one of his seasons and teammates in those seasons and average them. I do this for every driver, and they all get a new score for the second column of the table. (One rule is that two drivers must have been teammates for at least a third of the season to go into the mathematical model). Next, I drag this formula across in the Excel spreadsheet many, many times. If you were to do it with just two drivers, they would just oscillate between two scores, so on one column later on, I do the average of these scores. For example, if one driver was 0.5% faster than the other, that driver would oscillate between 99.5 and 100, the other would oscillate between 100 and 100.5, so the results would be 99.75 and 100.75, demonstrating correctly the 0.5% gap between the two drivers. But once there are enough teammate connections, all the values tend towards a point, so this averaging is usually not necessary, and they all get a score just from the original formula. These range from just below 100 to just above 100, but the actual number is irrelevant, the important bit is the gaps between the drivers. So that is how the mathematical model works, here are the results.

Drivers who are not connected to the main teammate web.

Some drivers are not connected to the main teammate web so are ranked separately. Most of these will join the main list once I add more seasons, but others will not.

image-1.png?w=402

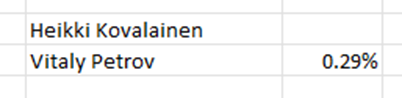
The Caterham drivers from 2012 are not connected to the rest of the grid but will be once I add previous seasons, starting with 2011 when Petrov was teammate to Bruno Senna. These results show that Kovalainen was, on average, 0.290% faster than Petrov in 2012.

image-2.png?w=398

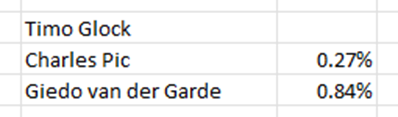
The 2012 Marussia drivers and the 2013 Caterham drivers will also be connected to the rest of the grid once I get back to 2009, when Glock was teammate to Jarno Trulli. Glock was 0.272% faster than Pic in 2012, and Pic was 0.569% faster than Van Der Garde in 2013. I was surprised at this large gap between the Caterham drivers in 2013 but trusted the Autosport results.

image-3.png?w=395

The 2012 HRT drivers will be connected to the rest of the grid once I get back to 2010, when De La Rosa was teammate to Kobayashi. De La Rosa was, as expected, 0.464% faster than Karthikeyan in 2012 on average.

image-4.png?w=408

The 2015 Manor drivers will never be connected to the rest of the grid unless, by some miracle, one of them gets another F1 drive. Will Stevens did race once alongside Kamui Kobayashi at Caterham in Abu Dhabi 2014, but this isn’t enough for a representative ranking. Stevens was 0.444% faster than Merhi in 2015, but the Manor was so far off the rest of the grid it is hard to know how good either of them really were. But they probably were the two weakest drivers on the grid.

image-5.png?w=384

The 2014 Marussia drivers will also never be connected to the rest of the grid, but Jules Bianchi, tipped to drive for Sauber in 2015 and perhaps Ferrari in the future before his fatal accident at Suzuka in 2014, was around 0.712% faster than Max Chilton, who was generally considered to be among the weakest drivers on the grid.

The overall ranking (2012-2022)

1 Lando Norris FASTEST

2 Max Verstappen +0.037%

3 Charles Leclerc +0.201%

4 Carlos Sainz +0.266%

5 Daniel Ricciardo +0.310%

6 Nico Hulkenberg +0.356%

7 Fernando Alonso +0.410%

8 Nico Rosberg +0.467%

9 Lewis Hamilton +0.509%

10 George Russell +0.513%

11 Pierre Gasly +0.542%

12 Paul di Resta +0.549%

13 Valtteri Bottas +0.579%

14 Alexander Albon +0.596%

15 Sergio Perez +0.601%

16 Kamui Kobayashi +0.603%

17 Esteban Ocon +0.627%

18 Adrian Sutil +0.639%

19 Michael Schumacher +0.646%

20 Sebastian Vettel +0.664%

21 Daniil Kvyat +0.683%

22 Felipe Massa +0.691%

23 Jean-Eric Vergne +0.734%

24 Pascal Wehrlein +0.740%

25 Jenson Button +0.744%

26 Romain Grosjean +0.751%

27 Antonio Giovinazzi +0.795%

28 Esteban Gutierrez +0.799%

29 Kimi Raikkonen +0.844%

30 Kevin Magnussen +0.865%

31 Felipe Nasr +0.870%

32 Stoffel Vandoorne +0.887%

33 Marcus Ericsson +0.916%

34 Sergey Sirotkin +0.931%

35 Mark Webber +0.950%

36 Brendon Hartley +0.952%

37 Pastor Maldonado +0.956%

38 Mick Schumacher +0.995%

39 Zhou Guanyu +1.023%

40 Lance Stroll +1.054%

41 Yuki Tsunoda +1.190%

42 Jolyon Palmer +1.236%

43 Nicholas Latifi +1.285%

44 Robert Kubica +1.292%

45 Rio Haryanto +1.473%

46 Nikita Mazepin +1.557%

47 Bruno Senna +1.779%

Notes

These notes are supposed to try and explain the position of the driver in the ranking and why it might be higher or lower than expected. But it is also possible that my musings are all based on bias, and the results shown are totally accurate as they have no bias at all. These results effectively summarise exactly what we are seeing on track, and these notes are explaining why this may be misleading.

  1. Lando Norris. This is a surprise that Lando Norris ranks at number one, considering he is yet to win a Grand Prix. The main reason for his high ranking is the huge gap between himself and Daniel Ricciardo in 2021 (0.416%) and 2022 (0.676%). The model considers this to be larger than the expected gap between them, as shown by the overall results, due to Norris having a very small advantage over Carlos Sainz in 2019-20 (0.030%) and Ricciardo doing better in other years, but the lack of other data for Norris probably inflates his score here, and I think it is unlikely that he is actually the fastest driver on the grid. Unfortunately, as he is currently teammate to a rookie in Oscar Piastri, his ranking will remain approximately the same in the coming years until he gets a representative teammate.
  2. Max Verstappen. There have been suggestions over the years of Red Bull building their cars to suit Max Verstappen’s driving style, thus exaggerating the gap between himself and his teammates, and perhaps causing him to have an inflated score here. However, it makes more sense that Verstappen should rank at the top considering he is widely considered to be the current best driver on the grid, and has totally dominated strong teammates in Perez (0.615%), Albon (0.767%) and Gasly (0.695%) recently. I think these differences are probably not far off being the genuine difference in their levels, even without a car that suits Verstappen, and he deserves his place this high on the list.
  3. Charles Leclerc. It may be that Leclerc’s ranking is also higher than is should be because of the fact that he destroyed a Sebastian Vettel in 2020 (0.702%) who was far from his best, although this model doesn’t really rate Vettel too highly just yet. He has also beaten Carlos Sainz in 2021-22 for outright pace (0.149%), actually by a greater margin than the overall gap between them, which gives him a high score due to Sainz’s excellent record against Verstappen and Norris.
  4. Carlos Sainz. Although he hasn’t beaten many teammates in his career, Sainz has been up against all of the top three on this list, all of whom have been accused of having cars that suit their driving styles better than their teammates, and has come very close to all three (0.030% to Norris, 0.100% to Verstappen and 0.149% to Leclerc), hence his position in fourth on the ranking. Sainz also beat Daniil Kvyat comprehensively in 2016 (0.420%) and less comprehensively in 2017 (0.108%), and was beaten by Nico Hulkenberg in 2018 (0.038%), which drags his score down a little.
  5. Daniel Ricciardo. Ricciardo ranks highly due to being much closer to Verstappen than most of his other teammates, as well as beating Hulkenberg in 2019 (0.180%), Vettel in 2014 (0.370%) and Ocon in 2020 (0.199%) and Vergne in 2012-2013 (0.419%). His terrible record against Norris in 2021-2022 (0.546%) brings his score down slightly, but it has a greater effect in improving Norris’ score as he has fewer other teammate connections.
  6. Nico Hulkenberg. This score may seem way too high considering Hulkenberg has never even been on the podium, but actually it is consistent with a lot of his gaps to teammates. He dominated Palmer (1.209%) and Gutierrez (0.618%) to a far greater extent than Magnussen and Grosjean did. Did he catch them at a good time or was this the genuine advantage he had over them? He also beat Perez in all three seasons (0.126%), edged out Sainz (0.038%) and wasn’t far off Ricciardo. Qualifying pace is probably his strongest area, and he perhaps isn’t given enough credit in this regard. Hulkenberg’s domination of Magnussen in qualifying in 2023 will further cement his position towards the top of this list.
  7. Fernando Alonso. This is a much lower ranking than is to be expected for Alonso, perhaps in part due to the use of many of his less impressive seasons and not yet having got into his better years in the 2000s, while the likes of Massa and Button are also currently not rated too highly as their best seasons are yet to be added to the model. Alonso wasn’t as far ahead of Ocon as might be expected (0.185%), due to his age, but dominated Massa (0.327%) and this will be shown more in the model as more years are added.
  8. Nico Rosberg. As Schumacher has no other teammate connections in this time period, Rosberg’s entire ranking is based off Lewis Hamilton, and while he was just behind him in 2013 (0.030%) and 2015 (0.159%), he had a greater advantage in 2014 (0.223%) and 2016 (0.135%) so ranks ahead overall. This is partly due to Hamilton having more bad luck in those seasons in qualifying which just about tilts the balance, but the two were actually very evenly matched in qualifying and Hamilton’s greater advantage came in the races, which are not included here. His ranking will be inaccurately inflated once more years are added due to him beating a Schumacher when he was past his best.
  9. Lewis Hamilton. Hamilton’s ranking is far too low in this model, but is likely to improve once the 2000s are added and him beating Alonso, dominating Kovalainen, and Button and Rosberg’s strong careers are added to the model. He wasn’t very far ahead of Bottas during their time as teammates (0.066%), with the greater difference being made in the races, and actually ranks just behind Rosberg because of 2014 and 2016, when he had more bad luck in qualifying sessions, although again the difference in qualifying was actually very small. Hamilton was also outpaced by Russell in 2022 (0.158%), partly due to the trialling of different setups, and Latifi’s terrible season made Russell look worse compared to Albon, bringing Hamilton’s ranking down in that regard as well.
  10. George Russell. Russell’s ranking is inflated by beating Hamilton in 2022 on supertimes, although he was generally narrowly outperformed by his teammate that year. But his ranking is mostly brought down by having a lesser gap to Latifi (0.692%) than Albon did (0.850%) during his Williams years, although Latifi appeared to be having a much worse season in 2022 than he had in 2020-2021.
  11. Pierre Gasly. As Tsunoda and Hartley have no other teammate connections, Gasly’s rating is purely based off his results relative to Verstappen and Kvyat, and while he had a poor half-season at Red Bull (0.695% down on Verstappen), the way he comfortably outperformed Kvyat (0.286%) showed that this was an unusually bad performance, and he is actually better than that half-season would suggest.
  12. Paul di Resta. Perhaps Nico Hulkenberg wasn’t at his best in 2012 and so Di Resta’s ranking is inflated by being closer to him than most (0.062%), while Hulkenberg himself is perhaps a little too high anyway. But Di Resta’s score is pulled down again a little by being outpaced by Sutil in 2013 (0.042%). Either way, he may have been overrated by this model, but it was probably harsh that he lost his drive altogether in 2013.
  13. Valtteri Bottas. Over their five years as teammates, Bottas was actually very close to Hamilton on outright pace (0.066%), (although it was in the races that the gap widened between them), and this is shown in the model. Bottas’ score also improves due to his ability to beat Massa over their three years as teammates (0.245%), although it is hurt by being outpaced by the mercurial Pastor Maldonado when he was a rookie (0.039%). Bottas’ score is probably a little too low here and will improve due to Hamilton’s doing likewise as a result of including more seasons.
  14. Alexander Albon. While Albon was beaten the most comprehensively of all Verstappen’s teammates, he earns a decent score here because Verstappen is rated so highly, and because he outperformed Kvyat in 2019 (0.206%) and mainly because in 2022 he was a long way ahead of Latifi (0.850%), further ahead than Russell had been in previous seasons (0.692%). Perhaps this means his score is a little too high as Latifi seemed to be having his worst season in 2022.
  15. Sergio Perez. Perhaps qualifying has always been his weakest area, as he outscored Hulkenberg in two of their three seasons as teammates but was outpaced by him on all three occasions (0.126% overall), and also struggled to get the better of Ocon in 2017-18 (still edging him by 0.035%), while he has particularly struggled in this area since joining Red Bull. His ranking is also hurt by not being as far ahead of Stroll for outright pace as others (0.355%). I think this ranking is probably about right for Perez.
  16. Kamui Kobayashi. Another driver who was forced out of Formula 1 too soon, but Kobayashi’s ranking is probably a bit too high here as he was teammate to Perez in his second season, being beaten by him (0.195%), and Ericsson as a rookie when he beat him by a comfortable margin (0.506%). Facing both drivers at their peak would probably have led to worse results for Kobayashi, although he was still good enough to be a solid midfield driver during the 2010s.
  17. Esteban Ocon. Ocon looked a potential top driver during his initial years with Force India when he was just slightly slower than Perez (0.035%), although this idea seemed to end when he was comfortably outpaced by Ricciardo in 2020 (0.199%), and again he was a little behind a declining Alonso at Alpine (0.185%). His score is also hurt by being narrowly outpaced by Wehrlein as a rookie in his half-season with Manor in 2016 (0.048%), which is unrepresentative due to the comparative lack of preparation. This model would suggest that he should have been a little behind Gasly in 2023 which has not been the case, although his experience with the team may have played a part here, so his ranking will probably improve once 2023 is added.
  18. Adrian Sutil. Narrowly outpaced Di Resta in 2013 (0.042%) to improve his score, but then it is hurt by being just a small amount ahead of Gutierrez in 2014 (0.029%) with Sauber. I think his actual level was shown more in 2013 as the 2014 Sauber was extremely uncompetitive, although Di Resta is perhaps a little overrated by the model so overall, I would suggest that this placing for Sutil is about right.
  19. Michael Schumacher. Obviously, this is not peak Michael Schumacher, it only includes the last of his comeback years in 2012. Even so, I think Schumacher has been slightly underrated by the model because I think Hamilton, and by extension Rosberg, the only driver whose ranking affects Schumacher’s, have been underrated by the model. Once the 2000s and 1990s are added, Schumacher will surely find himself towards the top of the list, and then Rosberg’s score will consequently be misleadingly inflated.
  20. Sebastian Vettel. Perhaps the biggest surprise in the ranking is the low placing of the champion of the first two seasons in the sample. His best seasons were with Red Bull and Mark Webber doesn’t yet have any other teammate connections, so for now these years effectively don’t count. He also did well alongside Kimi Raikkonen at Ferrari (winning overall by 0.223%), but Raikkonen is rated poorly by the model. Vettel was also surprisingly beaten comfortably by Ricciardo and Leclerc in 2014 (0.370%) and 2020 (0.702%), and was past his best when he faced Stroll (0.249%). His score will improve once the best years of Webber and Raikkonen are implemented to the model, but it is unlikely he will find himself right towards the top. Perhaps the four world championships flatters Vettel’s ability.
  21. Daniil Kvyat. Despite seeming to underperform for many years at Toro Rosso, the average supertimes would suggest that Kvyat didn’t do as badly as the points tables would suggest, edging out Vergne in 2014 (0.061%) and being close to Sainz in 2017 (0.108%), albeit less so in 2016 (0.420%). However, he was beaten comprehensively by Gasly in 2019-20 (0.286%), so does rank below all these drivers. But perhaps Kvyat was better than he is generally given credit for.
  22. Felipe Massa. Some speculate that Massa was never the same driver after his Hungary accident in 2009 so this model doesn’t yet include his best seasons. During the period, Massa was quite soundly beaten by Alonso in 2012-13 (0.327%), and also by Bottas across 2014-16 (0.245%). However, Stroll had a particularly poor season in 2017 so Massa’s domination of him (0.851%) inflates his ranking somewhat. But as his other teammates have probably been underrated, I would suggest that Massa’s ranking is about right, or slightly too low, for this period, and will improve once the late 2000s are included.
  23. Jean Eric Vergne. Qualifying was always Vergne’s biggest weakness in Formula 1, despite his excellent pole record in Formula e, and so he had quite a significant gap to Ricciardo (0.419%) and was also narrowly beaten by Kvyat in 2014 (0.061%). Although his race pace was better, this placing for outright speed is probably about right for Vergne. Although he was teammate to Ricciardo during his early years, Vergne was even less experienced so could have improved by a similar amount to Ricciardo had he been given more years in Formula 1.
  24. Pascal Wehrlein. Despite only having two seasons with backmarker teams in Formula 1, Wehrlein was fairly highly rated and was considered unlucky to lose his drive at the end of 2017. In his rookie season, he comfortably outpaced Rio Haryanto in the first half of the year (0.732%) but managed to just edge Esteban Ocon as well in the second half (0.048%), which means his ranking is probably too high as he had far more preparation than Ocon and probably wouldn’t have beaten him otherwise. Wehrlein’s second season with Sauber was less impressive and Ericsson was very close to his level, if still a little behind (0.013%).
  25. Jenson Button. Another surprise of the model is the low placing of a world champion in Jenson Button, although his best seasons probably took place before 2012, and while qualifying was never his strong point, he will move up the order once those better seasons are added. Button was quite clearly outpaced by Hamilton in 2012 (0.414%) and by Alonso in 2015-16 (0.328%), and also only just beat Magnussen in 2014 (0.012%) which hurts his ranking, although as all three of the aforementioned drivers are probably underrated by the model, it follows that Button is as well, and he did manage to beat Perez in 2013 (0.134%).
  26. Romain Grosjean. Although he had a reputation for crashing a lot, over his career, Grosjean was also very fast in qualifying, so it is surprising that he places so low here. He managed to narrowly beat Raikkonen for outright pace across 2012-13 (0.011%) although in the races he was well behind, yet Raikkonen is rated poorly here, and Grosjean also beat Maldonado (0.410%) who was known as a one-lap specialist. His ranking is hurt by struggling to beat Gutierrez by much (0.005%), perhaps because Gutierrez had improved since his Sauber days, but Grosjean also did not like the 2016 Haas at all. And he narrowly held the edge over Magnussen across 2017-20 (0.060%) but Magnussen is rated poorly by the model. Grosjean’s score will improve, and deservedly so, once the extent of Maldonado’s destruction of Senna becomes relevant (when Senna gets other teammates), and once Raikkonen’s better years are included in the model.
  27. Antonio Giovinazzi. Across their three seasons as Alfa Romeo teammates, Giovinazzi gradually gained the upper hand over Raikkonen and overall was faster than him (0.049%). But this was Raikkonen at the weakest point of his career, just before his retirement, so Giovinazzi is probably a little overrated by the model. But not by much, as Raikkonen himself is very poorly rated based on this time period.
  28. Esteban Gutierrez. The statistic of scoring just one points finish in his entire career does not do Gutierrez justice, and the 2016 score of 0 points to the 29 of Grosjean is very misleading as for outright pace, Gutierrez was just a very small amount behind Grosjean (0.005%). He was similarly close behind Sutil in 2014 (0.029%) but was beaten by a large amount by Hulkenberg in 2013 (0.618%). I think Gutierrez is a little overrated by the model, as Grosjean and Sutil weren’t performing at their best in those difficult cars, but he wasn’t as bad as the points totals would suggest.
  29. Kimi Raikkonen. A shockingly low score for a former world champion, but since 2012, qualifying has not been his strongest suit, he has been past his best anyway throughout this period, while his teammates Grosjean, Alonso and Vettel, all of whom beat him, are probably underrated by the model. Raikkonen was beaten by some margin by Alonso in 2014 (0.417%) in a Ferrari that suited his teammate more than him, and was closer to Vettel across 2015-18 (0.223%) although Vettel is not rated too highly here, and neither is Grosjean who narrowly outpaced Raikkonen in qualifying (0.011%) but was much slower for race pace. Raikkonen’s score will improve once his better Ferrari and McLaren years are included, but he is unlikely to feature too near the top of the list.
  30. Kevin Magnussen. In his rookie season, Magnussen was very close to the level of Button, but that is estimated to be his strongest season and his ranking is hurt badly by only just beating Jolyon Palmer in 2016 (0.043%), the year before Palmer was destroyed by Hulkenberg (1.209%). I would suggest that 2017 was a disproportionately bad year for Palmer and so Magnussen is underrated by the model as a result of this. He was very close to Grosjean’s pace throughout their years as teammates (0.060%), and I think that both Haas drivers from that time should be rated more highly, and they will be once more years are added.
  31. Felipe Nasr. With two years at Sauber, Nasr’s rating is entirely dependent on Ericsson’s, and in his first season Nasr beat Ericsson (0.223%), who stepped up in 2016 and got the better of Nasr (0.131%), but overall Nasr holds a slight edge (0.046%). Ericsson is probably slightly overrated by being teammate to a rookie Leclerc and a Wehrlein who I think is overrated by the model, so by extension Nasr is also, particularly as 2015 was a particularly bad year for Ericsson.
  32. Stoffel Vandoorne. Two years of being destroyed by Fernando Alonso (0.477%) ended a promising Formula 1 career that has since been rewarded with a Formula e championship. Vandoorne probably didn’t face Alonso at his absolute peak, but as Alonso is underrated by this model which doesn’t include many of his best seasons, Vandoorne’s placing is probably about right. Once the 2000s are included, Alonso’s score, and by extension Vandoorne’s, will improve and then Vandoorne will probably be overrated by the model.
  33. Marcus Ericsson. Ericsson was beaten by a significant margin by Kobayashi in 2014 (0.506%), and was also beaten by Nasr in 2015 (0.223%), but he seemed to make a step up in 2016 by beating Nasr (0.131%), then being close to Wehrlein in 2017 (0.013%), but was quite far away from Leclerc in 2018 (0.685%). But I think overall he is slightly overrated by the model, due to Leclerc being a rookie when they were teammates, and Wehrlein being rated too highly due to beating Ocon in unusual circumstances.
  34. Sergey Sirotkin. Sirotkin’s placing is entirely dependent on Stroll’s, and during his only season, Sirotkin was able to narrowly outpace Stroll (0.123%) so is above him here. But Stroll improved in the seasons after moving to Racing Point, so Sirotkin’s ranking is probably too high here as a result of facing a weaker version of Stroll.
  35. Mark Webber. The only seasons included here for Webber are 2012 and 2013 when he was outpaced by Vettel by a more significant amount (0.287%) due to not liking the tyres, and for aforementioned reasons, Vettel is rated too low by the model, so combining these two factors means Webber has a ridiculously low rating here. Once earlier seasons are included, he will be much higher as he was better in the years prior to switching to Pirelli in 2011, and Vettel’s score will improve to a more representative level, thus bringing Webber up as well.
  36. Brendon Hartley. Hartley’s score depends only on Gasly, who he was quite far behind during their season as teammates, and if anything, this ranking flatters Hartley as Gasly was in his first full season in 2018 (0.410%). Admittedly, Hartley was as well, although he had more experience in endurance racing.
  37. Pastor Maldonado. During the 2012 season, Maldonado was very much touted as a one-lap specialist, when he destroyed Bruno Senna by one of the largest gaps between two teammates in the sampled period (0.822%), although as it was Senna’s final season, it doesn’t affect Maldonado’s score in this ranking. He also narrowly beat Bottas in 2013 (0.039%) but was beaten by Grosjean in 2014-15 (0.410%), who isn’t very highly rated, so this brings Maldonado’s rating down to a very low and unrepresentative ranking. He will correctly be much higher once more seasons are added.
  38. Mick Schumacher. After destroying Mazepin in his rookie season (0.562%), Schumacher’s rating comes only from the 2022 season, when he was a little behind Magnussen (0.130%), and so this ranking seems about right as Magnussen is probably too low, but wasn’t having his best season in 2022. Schumacher’s main problem was crashing which doesn’t really make much difference in this model. Perhaps he would still be driving for Haas now had Mazepin continued as his teammate beyond 2021.
  39. Zhou Guanyu. Zhou’s ranking is also based just off one driver, Bottas in 2022, and he was quite far off Bottas (0.444%) but considering it was Zhou’s rookie season, and it wasn’t Bottas at his best, this placing seems quite reasonable.
  40. Lance Stroll. Although he has gradually improved over his years in Formula 1, Stroll has still rarely shown to be better than the bottom group of drivers on the grid, so it is unsurprising that he ranks low down here, particularly as qualifying has generally been a weakness of his. His 2017 season brings the ranking down as he was a long way off Massa (0.851%), but he fared better against Perez in 2019-20 (0.355%) and also a declining Vettel in 2021-22 (0.249%), but was still behind both drivers.
  41. Yuki Tsunoda. Tsunoda ranks very low because of his 2021 season when he was a significant distance behind Gasly (1.040%), although he cut this gap in 2022 when it was much closer (0.255%), but the average of the two remains large. In 2023 he seems to have improved further and so his ranking will go up due to the good results relative to Ricciardo.
  42. Jolyon Palmer. Palmer’s 2017 season mainly brings his score down as he was beaten by Hulkenberg by the single largest gap between two teammates of the entire time period (1.209%), although he clearly wasn’t at his best that season and was far closer to Magnussen in 2016 (0.043%), thus bringing Magnussen’s score down almost as much as it brings his up.
  43. Nicholas Latifi. In general, Latifi didn’t do too badly in 2020-21 relative to his teammate (0.692%), considering George Russell has gone on to run Lewis Hamilton closely at Mercedes. But perhaps Abu Dhabi 2021 mentally broke him, because by comparison, 2022 was an awful season and he had an even larger gap to Alex Albon (0.850%) who probably isn’t as strong a driver overall. Therefore, it is unsurprising that he is among the lowest ranked drivers.
  44. Robert Kubica. Once peak Kubica’s seasons are added to this ranking, George Russell’s score will be disproportionately improved as Kubica in 2019 was nowhere near the level he had once been, and that is the only season that counts to this list so far. He was comprehensively beaten by a rookie George Russell (0.779%).
  45. Rio Haryanto. Haryanto raced just half a season with Manor in 2016 and while he sometimes outqualified Wehrlein, his overall supertime was some way off (0.732%) and so he ranks among the lowest of all the drivers who have raced since 2012, which isn’t too surprising.
  46. Nikita Mazepin. Considering Mick Schumacher, who had so clearly dominated Mazepin in the same car in 2021, lost his seat in Formula 1 just one year later, it should be no surprise that Mazepin ranks right towards the bottom of the list, having been comfortably outpaced by Schumacher in his one season in Formula 1 (0.562%).
  47. Bruno Senna. Although he should be close to it, it is overly harsh that Bruno Senna ranks right at the bottom of the list, because the only one of his seasons included here is 2012 when, in qualifying at least, he was destroyed by Maldonado (0.822%). But the full extent of Maldonado’s one-lap pace hasn’t yet been realised by this model, which considers him a below average driver and so thinks that Senna is terrible. Once Senna’s 2010 and 2011 seasons are included, he will rightly move up the table a little, and Maldonado will correctly move much higher even if his crashing and Senna’s lack of pace meant that the 2012 Williams was effectively wasted in terms of points scored, but Senna is not the worst driver since 2012.

So that is my mathematical model, riddled with flaws of course, although the major positive of this model is that it is extremely simple and so it is very obvious why any surprise results have taken place. Any ideas of how to improve it would be welcome although I don’t think it is possible to create a particularly accurate model and just think it is interesting as a rough baseline for the drivers’ level. Any results for supertimes of other seasons would also be greatly appreciated.

This will be updated in the future as I add the 2023 season and many more years from before 2012. I hope you enjoyed reading it, and, I emphasise again because I know someone will, please don't think that I am claiming these results to be in any way definitive. It is just meant to be interesting.


Edited by F1Frog, 03 November 2023 - 13:24.


Advertisement

#2 1player

1player
  • Member

  • 1,318 posts
  • Joined: March 21

Posted 03 November 2023 - 13:26

I was about complain about any model that puts Perez in #2 (first chart), but I read further and I can't argue with anything that puts Norris close by Verstappen :p

I'll take more time to read in depth your post, but I wanted to say:

1. Massive props for this effort
2. How the hell did we not have a model thread yet? This is sorely needed and I bet someone else has their pet Excel sheet they'd like to share.

So thanks and well done.

EDIT: yes, the arbitrary cutoff date of 2012 overrates younger drivers (like Norris) and underrates older drivers (like Hamilton and Alonso). These numbers would make more sense if they measured the entire career span of each driver.

Edited by 1player, 03 November 2023 - 13:30.


#3 Stephane

Stephane
  • Member

  • 4,500 posts
  • Joined: February 10

Posted 03 November 2023 - 13:29

Ranking mathematically the drivers seems like the holy grail. Many attempts.

#4 Afterburner

Afterburner
  • RC Forum Host

  • 9,239 posts
  • Joined: January 11

Posted 03 November 2023 - 13:35

I collaborate with folks who build mathematical models for a living, so would love to dig into this in detail later. What immediately stands out to me in your output though is that your model has a bias for drivers who are currently on the grid. It looks like, based on your methodology, a good way to test whether or not this bias is based on your method (it seems you started with Verstappen and worked your way back to 2012?) would be to assume that time flows backwards (lol) and work under the assumption that 2012’s grid is the present grid and do what you did beginning with those drivers working “back” to 2023. This of course won’t account for the real-world decline in pace for aging drivers, but I don’t have time to consider it any further!

Apologies if my suggestion is off the mark and all of these are interconnected in a giant system that functions independent of time—a different strategy would be needed to correct for aging (maybe weighting peak performance). When I get more time I’ll dig into it further. :)

#5 F1Frog

F1Frog
  • Member

  • 654 posts
  • Joined: August 21

Posted 03 November 2023 - 13:38

I was about complain about any model that puts Perez in #2 (first chart), but I read further and I can't argue with anything that puts Norris close by Verstappen :p

I'll take more time to read in depth your post, but I wanted to say:

1. Massive props for this effort
2. How the hell did we not have a model thread yet? This is sorely needed and I bet someone else has their pet Excel sheet they'd like to share.

So thanks and well done.

EDIT: yes, the arbitrary cutoff date of 2012 overrates younger drivers (like Norris) and underrates older drivers (like Hamilton and Alonso). These numbers would make more sense if they measured the entire career span of each driver.


Thank you, I too would love to see any projects others have come up with.

And the arbitrary 2012 cut off is just because I only have the data back to 2012 for now. But I will obtain more years in time and update the model when I get them.

#6 F1Frog

F1Frog
  • Member

  • 654 posts
  • Joined: August 21

Posted 03 November 2023 - 13:42

I collaborate with folks who build mathematical models for a living, so would love to dig into this in detail later. What immediately stands out to me in your output though is that your model has a bias for drivers who are currently on the grid. It looks like, based on your methodology, a good way to test whether or not this bias is based on your method (it seems you started with Verstappen and worked your way back to 2012?) would be to assume that time flows backwards (lol) and work under the assumption that 2012’s grid is the present grid and do what you did beginning with those drivers working “back” to 2023. This of course won’t account for the real-world decline in pace for aging drivers, but I don’t have time to consider it any further!

Apologies if my suggestion is off the mark and all of these are interconnected in a giant system that functions independent of time—a different strategy would be needed to correct for aging (maybe weighting peak performance). When I get more time I’ll dig into it further. :)

I think the bias towards current drivers is sort of a coincidence. Maybe it is because those top drivers’ declining years haven’t happened yet, or maybe the top three all just happen to be drivers who have been accused of having cars built around them and are all recent. I didn’t start with Verstappen; every driver starts with a base score of 100 so in column 2 they are being compared assuming every driver is equal. Then column 3 compares them based on the column 2 score and so on until each driver’s score tends to one particular value, the difference between which are shown in the results table.

At some point I will try to find the age of peak performance and adjust for this but this is just the first and very simplest version of the model.

Edited by F1Frog, 03 November 2023 - 13:44.


#7 1player

1player
  • Member

  • 1,318 posts
  • Joined: March 21

Posted 03 November 2023 - 13:47

The bias towards current, younger drivers might turn this into a good "who to keep an eye on in 2023?"

Hamilton and Alonso are good, but they're not hot property anymore, which is reflected in the numbers.

#8 efuloni

efuloni
  • Member

  • 768 posts
  • Joined: November 16

Posted 03 November 2023 - 13:54

I liked it a lot.
Please post the updates.

#9 Collombin

Collombin
  • Member

  • 8,659 posts
  • Joined: March 05

Posted 03 November 2023 - 14:02

This is sorely needed


It really isn't. And I say that with all due respect to the OP who has a grasp of the sport well beyond many of the people who will no doubt use it to draw and believe potentially absurd conclusions because maths. The flaws are well covered and explained, but give a child a chainsaw and the small print in the instructions probably won't make much difference.

Having said all that, if this has to be done at all then the approach is better than most. Won't it by default tend to emphasise qualifying performance rather than race performance though?

#10 Anderis

Anderis
  • Member

  • 7,413 posts
  • Joined: December 09

Posted 03 November 2023 - 14:23

People often don't like results of these mathematical models to rate drivers and I usually wasn't very quick to criticise the outcome- after all it seems to be a bit arrogant to assume your driver judgement is infallible and if you disagree with something, it must have been the model that's at fault and not your judgement.


But I have to say this model has delivered the strangest results I've ever seen. Having Vettel rated below Sutil, Raikkonen below Guttierez or Webber below Ericsson are things I would've never expected to see even in the most flawed model.


#11 Collombin

Collombin
  • Member

  • 8,659 posts
  • Joined: March 05

Posted 03 November 2023 - 14:41

it seems to be a bit arrogant to assume your driver judgement is infallible and if you disagree with something, it must have been the model that's at fault and not your judgement

Almost by definition everyone thinks their opinion is correct, but the model makers themselves are usually (but not in this instance) the arrogant ones, telling us on more than one occasion why their foolproof objective spreadsheet is correct and our limited, biased views are wrong. I can't remember if the guy who had Christian Fittipaldi as the 11th best driver ever fell into the arrogant category or not but I hope he did.

There is no Holy Grail correct ranking obtainable by number crunching (and especially not across eras),because different people value things differently. I suppose the best you could ever hope for was one that asked you how much weight to apply to certain areas (wet weather performance, how much to "penalise" wins in a rocketship and vice versa, skills as a test driver, on track behaviour, qualifying importance, crash percentage, era bias, versatility, career peak form or overall etc etc) and maybe come up with something based on your preferences in that way. But the underlying data required to get to that would be overwhelming and probably still be open to error. Race statistics often don't reflect the quality of the individual performances. So at what point is it best to think it probably isn't worth it?

Edited by Collombin, 03 November 2023 - 14:45.


#12 1player

1player
  • Member

  • 1,318 posts
  • Joined: March 21

Posted 03 November 2023 - 15:04

It really isn't. And I say that with all due respect to the OP who has a grasp of the sport well beyond many of the people who will no doubt use it to draw and believe potentially absurd conclusions because maths. The flaws are well covered and explained, but give a child a chainsaw and the small print in the instructions probably won't make much difference.

Having said all that, if this has to be done at all then the approach is better than most. Won't it by default tend to emphasise qualifying performance rather than race performance though?


I don't get the negativity. I don't care for statistics and I don't really trust models, but the discussion around them is much more interesting than another topic on some social media rumour or other nonsense, so I personally welcome more intelligent discussion than empty speculation.

#13 AncientLurker

AncientLurker
  • Member

  • 728 posts
  • Joined: March 22

Posted 03 November 2023 - 15:07

I don't get the negativity. I don't care for statistics and I don't really trust models, but the discussion around them is much more interesting than another topic on some social media rumour or other nonsense, so I personally welcome more intelligent discussion than empty speculation.

I believe Collombin was (correctly) pointing out that the these ranking systems just add more fuel to driver vs. driver wars with no positive upside.


#14 Collombin

Collombin
  • Member

  • 8,659 posts
  • Joined: March 05

Posted 03 November 2023 - 15:14

I don't get the negativity. I don't care for statistics and I don't really trust models, but the discussion around them is much more interesting than another topic on some social media rumour or other nonsense, so I personally welcome more intelligent discussion than empty speculation.


Agree on that. I didn't mean to be too negative. I don't have any criticisms of this model that the creator himself doesn't have, I just know how easy it is to overlook those and am just hoping it is seen for the interesting analysis that it is and not something that can definitively answer whether A is better than B. That was all. I'm sure it will provide some revealing little nuggets here and there.

Edited by Collombin, 03 November 2023 - 15:15.


#15 PlatenGlass

PlatenGlass
  • Member

  • 4,714 posts
  • Joined: June 14

Posted 03 November 2023 - 15:19

I don't think the description of how the model works is actually that clear.


Regardless, like all models of this type, it's always fun to watch the forum go into meltdown over the results.


#16 NewMrMe

NewMrMe
  • Member

  • 880 posts
  • Joined: August 12

Posted 03 November 2023 - 16:23

The problem with most mathematical models is that a lot of them appear to assume that a driver's performance level is a constant across their career and that is how you can compare drivers across teams. This is clearly not true, as drivers are going to improve near the beginning of their career as they gain experience and then at some point later on go into decline. On top of that there is form, drivers can have good or bad seasons, some cars will suit some drivers better than others.


There have been many rock-paper-scissors scenarios when comparing teammates, how does the model account for these?


I would very much interested in models for ranking drivers but I do think it is an impossible task. Say you have the situation where two drivers had one season together as teammates and driver B unexpectedly beat driver A. There are multiple explanations.

- Driver B is actually better than Driver A.

- Driver A had a poor season and performed better in other years.

- Driver B performed better this season than they did in other years.

- The car particularly suited Driver B.

- The car did not suit Driver A.


Is it possible for a model to determine which of the above (or combination of the above) did occur? If not, a model is going to have to assume one of the above and that is going to have a knock on effect for other rankings.


Edited by NewMrMe, 03 November 2023 - 16:24.


#17 Anderis

Anderis
  • Member

  • 7,413 posts
  • Joined: December 09

Posted 03 November 2023 - 16:27

but the model makers themselves are usually (but not in this instance) the arrogant ones, telling us on more than one occasion why their foolproof objective spreadsheet is correct and our limited, biased views are wrong.

I can't recall even one instance that the model maker argued their model was foolproof and everyone else was wrong. It doesn't mean that it has never happened but I'm sure for every such instance we have several people mocking the results without providing any constructive criticism.


It doesn't mean that the model makers are always in the right here but the issue is that if someone has hyphotetically managed to construct a model that's 100% correct, I'm sure it would yield some results that go very much against the popular opinion. So having the model yield results that go against the popular opinion is not a basis to invalidate the model if you provide no further explanation of how you think the model could've yielded wrong conclusions.


Edited by Anderis, 03 November 2023 - 16:28.


#18 Anderis

Anderis
  • Member

  • 7,413 posts
  • Joined: December 09

Posted 03 November 2023 - 16:49

What I think has happened in this particular model is Ricciardo's 2021/2022 outlier against Norris. Since Ricciardo's record prior to being paired with Norris was great, it has bumped Norris estimation disproportionately. Then it indirectly bumped Sainz through positive comparison with Norris and Hulkenberg through positive comparison with Sainz and Di Resta through comparison with Hulkenberg. And because Ricciardo has been beaten so badly by Norris, it has driven down Vettel's estimation and further indirectly all of Vettel's team mates as Raikkonen and Webber seem to be among the most underrated drivers here.


It would be interesting to see what would happen if you removed McLaren 2021-2022 battle from the equation.


Edited by Anderis, 03 November 2023 - 16:50.


#19 Collombin

Collombin
  • Member

  • 8,659 posts
  • Joined: March 05

Posted 03 November 2023 - 16:54

if someone has hyphotetically managed to construct a model that's 100% correct, I'm sure it would yield some results that go very much against the popular opinion. So having the model yield results that go against the popular opinion is not a basis to invalidate the model if you provide no further explanation of how you think the model could've yielded wrong conclusions.


But what does 100% correct mean? What does it look like? There's no such thing.

Explanations of the flaws are often easy enough to ascertain, as they usually relate (as already mentioned) to an inability to cope with fluctuations in form, treating some other variables as constants, accounting for the speed and reliability of the car (another minefield in itself, usually avoided, probably because of the mines), etc. If you don't adjust for anything then model output will closely match actual results (with all the other factors ignored) so why bother, and if you do make adjustments then immediately the basis can be criticised because we would all do it a different way.

Advertisement

#20 F1Frog

F1Frog
  • Member

  • 654 posts
  • Joined: August 21

Posted 03 November 2023 - 17:01

People often don't like results of these mathematical models to rate drivers and I usually wasn't very quick to criticise the outcome- after all it seems to be a bit arrogant to assume your driver judgement is infallible and if you disagree with something, it must have been the model that's at fault and not your judgement.


But I have to say this model has delivered the strangest results I've ever seen. Having Vettel rated below Sutil, Raikkonen below Guttierez or Webber below Ericsson are things I would've never expected to see even in the most flawed model.


Fair enough, I will try to show why Vettel is below Sutil, for example.

Ricciardo's gap to Vettel was 0.370%

Ricciardo to Hulkenberg was 0.180%

Hulkenberg to Di Resta was 0.062%

Sutil's gap to Di Resta was 0.042%.


Combining these puts Ricciardo 0.200% ahead of Sutil, and so Sutil is 0.170% ahead of Vettel.


Obviously, you can connect Vettel and Sutil in many other ways. Going through Leclerc and Sainz initially gives Sutil an even greater advantage. Going through Gutierrez, Grosjean and Raikkonen puts Vettel ahead. If you average every possible combination (that is sort of what is going on - I am about to post a more detailed explanation of how it works), Sutil comes out ahead of Vettel by 0.025%.


These results can be put down to Vettel having a bad season when he faced Ricciardo in 2014, and Leclerc in 2020 (and to a lesser extent 2019). But why do we think Vettel wasn't at his best in those seasons? It is just a bias we have. This example of a totally unbiased viewpoint considers Sutil to be better than Vettel. Your opinion, biased by Vettel's four world championships and Sutil's zero podiums, is that Vettel is actually better than Sutil. But the crucial thing here is that biased doesn't necessarily mean wrong. I have the same bias and totally agree with you that Vettel was better than Sutil even if the data suggests otherwise, because data can be misleading. I don't think the model is particularly accurate at all, I just think it is interesting to see a summary of a totally unbiased interpretation of the data.


#21 efuloni

efuloni
  • Member

  • 768 posts
  • Joined: November 16

Posted 03 November 2023 - 17:02

Everyone knows the limitations of statistics and math models.

It is just for fun.

Whoever takes this too seriously is the one who is wrong.

#22 F1Frog

F1Frog
  • Member

  • 654 posts
  • Joined: August 21

Posted 03 November 2023 - 17:09

Almost by definition everyone thinks their opinion is correct, but the model makers themselves are usually (but not in this instance) the arrogant ones, telling us on more than one occasion why their foolproof objective spreadsheet is correct and our limited, biased views are wrong. I can't remember if the guy who had Christian Fittipaldi as the 11th best driver ever fell into the arrogant category or not but I hope he did.

There is no Holy Grail correct ranking obtainable by number crunching (and especially not across eras),because different people value things differently. I suppose the best you could ever hope for was one that asked you how much weight to apply to certain areas (wet weather performance, how much to "penalise" wins in a rocketship and vice versa, skills as a test driver, on track behaviour, qualifying importance, crash percentage, era bias, versatility, career peak form or overall etc etc) and maybe come up with something based on your preferences in that way. But the underlying data required to get to that would be overwhelming and probably still be open to error. Race statistics often don't reflect the quality of the individual performances. So at what point is it best to think it probably isn't worth it?


I totally agree with you that mathematical models are not a particularly accurate way of comparing drivers, but the point isn't to give a definitive ranking because that is impossible. I just think it is interesting to see what an unbiased interpretation of the data gives as results and then we can analyse it and decide where it is misleading. I think a good advantage of my model is that it is simple and so easy to see why unexpected results have come up, and then to decide if these results are accurate or not subjectively. You say it isn't worth it but it is just for fun. I get great satisfaction out of plugging all my data into a formula on excel and seeing it produce a result which I don't agree with but can understand why it has come up.


And about the Christian Fittipaldi model, I remember in the write up of that it is mentioned that another model put Mike Hawthorn fifth, and another put James Hunt sixth. It says that both of the creators tried to argue that it was because these drivers are underrated but that really it shows a flaw in their models. It then proudly says that there are no surprise results like this in their top ten, before revealing that Christian Fittipaldi is 11th (a much more bizarre result than Hawthorn 5th and Hunt 6th) and then claiming that he is underrated. But the problem with that model is that it doesn't make sense to me at least, why Fittipaldi is 11th, apart from a brief mention that he had much better reliability than his teammates. Also, Prost is 2nd in that model and Lauda outside the top 50, which is hard to understand when Lauda beat Prost as teammates in 1984; even though I subjectively think that Prost was considerably better than Lauda in 1984, the raw data says otherwise.


Edited by F1Frog, 03 November 2023 - 17:27.


#23 F1Frog

F1Frog
  • Member

  • 654 posts
  • Joined: August 21

Posted 03 November 2023 - 17:11

I believe Collombin was (correctly) pointing out that the these ranking systems just add more fuel to driver vs. driver wars with no positive upside.

Perhaps, but I think I was quite clear about the flaws in the model and it is not my fault if people wrongly interpret the data as proof that their driver is better than another.


#24 Collombin

Collombin
  • Member

  • 8,659 posts
  • Joined: March 05

Posted 03 November 2023 - 17:18

the point isn't to give a definitive ranking because that is impossible

Make this a 72 size font in bold and all is good 🙂

I did only mean "worth it" in terms of attempts to use it to formulate a definitive ranking. If you enjoy creating and posting the data and the audience enjoy poring over it then it's absolutely worth it in that sense.

Edited by Collombin, 03 November 2023 - 17:19.


#25 Sterzo

Sterzo
  • Member

  • 5,098 posts
  • Joined: September 11

Posted 03 November 2023 - 17:18

As a bear of little brain, I could no more build a mathematical model than beat Max Verstappen over a lap. However, doesn't the real problem lie in expressing what the model represents? Surely the word "Fastest" against Norris's name is incorrect? Without doubt he has scored highest in the Frog Factor, but that by no means indicates he's the fastest. He's there because his team-mate slumped in form, which has nothing whatever to do with his own speed.


#26 IrvTheSwerve

IrvTheSwerve
  • Member

  • 5,102 posts
  • Joined: July 15

Posted 03 November 2023 - 17:20

My career is extremely mathematics-based, so I'm always a fan of models to simulate stuff.


I do think that there are far too many variables to determine a driver ranking, but it's really interesting. You'll never know who is the fastest F1 driver ever unless you stick them all in the same car, in their prime, for 20+ qualifying laps. Even then, you could argue about cars, driving style, etc. It's a really difficult sport to judge talent. 


#27 F1Frog

F1Frog
  • Member

  • 654 posts
  • Joined: August 21

Posted 03 November 2023 - 17:23

I don't think the description of how the model works is actually that clear.


Regardless, like all models of this type, it's always fun to watch the forum go into meltdown over the results.

Apologies, I will try to explain it in more detail by using an example.


Take Carlos Sainz, his results against teammates are:

+0.100% against Verstappen (2015)

-0.420% against Kvyat (2016)

-0.108% against Kvyat (2017)

+0.038% against Hulkenberg (2018)

+0.028% against Norris (2019)

+0.032% against Norris (2020)

+0.132% against Leclerc (2021)

+0.166% against Leclerc (2022)


In the first column of my excel table is a list of all 47 drivers in the final ranking.

In the second column, every driver has a value of 100.

In the third column, is the formula. Sainz's number = Verstappen's number of the previous column (100) +0.100 + Kvyat's 100 - 0.420 + Kvyat's 100 - 0.108 etc. then divided by 8 as there are eight teammate connections here. The result given for Sainz in this third column is now 99.996. As all his teammates had a score of 100 before, this means that -0.004 is actually the average of the eight percentages listed above.


However, the same formula has been done for 46 other drivers and all their teammates. Verstappen's score is now 99.577. Kvyat's is 100.218. Hulkenberg 99.735. Norris 99.712. Leclerc 99.646. This shows that actually Sainz was up against a strong set of teammates. If you drag the formula across to the fourth row, now Sainz's score is being compared to all these lower numbers instead so his score drops to 99.804. Then to 99.813. Then 99.744. It seems to move around randomly for a while but eventually tends towards a score of 99.637. At this time, every other driver has also tended to a single point. Lando Norris' tends to 99.371. So that is why Sainz has a score overall of +0.266% compared to Norris (the exact number 99.637 is irrelevant because 100 is an arbitrary starting point, but you could start anywhere and he would end up 0.266% behind Norris).


So that is how the model works, I hope this makes it clearer. By the way, this tending to a point doesn't work for the 'disconnected drivers' at the top because they don't have enough teammate connections to do this, but every one of the 47 in the overall ranking list does tend to a single value.


#28 F1Frog

F1Frog
  • Member

  • 654 posts
  • Joined: August 21

Posted 03 November 2023 - 17:27

The problem with most mathematical models is that a lot of them appear to assume that a driver's performance level is a constant across their career and that is how you can compare drivers across teams. This is clearly not true, as drivers are going to improve near the beginning of their career as they gain experience and then at some point later on go into decline. On top of that there is form, drivers can have good or bad seasons, some cars will suit some drivers better than others.


There have been many rock-paper-scissors scenarios when comparing teammates, how does the model account for these?


I would very much interested in models for ranking drivers but I do think it is an impossible task. Say you have the situation where two drivers had one season together as teammates and driver B unexpectedly beat driver A. There are multiple explanations.

- Driver B is actually better than Driver A.

- Driver A had a poor season and performed better in other years.

- Driver B performed better this season than they did in other years.

- The car particularly suited Driver B.

- The car did not suit Driver A.


Is it possible for a model to determine which of the above (or combination of the above) did occur? If not, a model is going to have to assume one of the above and that is going to have a knock on effect for other rankings.


All true, this is the limitation of the model. In terms of the rock-paper-scissors question, one example (sort of) is Nasr vs Ericsson at Sauber. In 2015, Nasr won by 0.223%. In 2016, Ericsson won by 0.131%. The model is based on averages so overall, Nasr wins by (0.223-0.131)/2 = 0.046%. As Nasr has no other teammates, this is the final difference between the two. But actually this is happening with every driver in every teammate connection (see the Vettel-Sutil example above). It is sort of just finding the average between all the different ways of connecting two drivers. But the Nasr-Ericsson example is the simplest, I think.


#29 F1Frog

F1Frog
  • Member

  • 654 posts
  • Joined: August 21

Posted 03 November 2023 - 17:28

Make this a 72 size font in bold and all is good
 

Okay, I edited it to make it a bit bigger :)

Also, this is only comparing drivers' qualifying speed, not their overall ability. Because doing qualifying speed only is easier.


Edited by F1Frog, 03 November 2023 - 17:28.


#30 F1Frog

F1Frog
  • Member

  • 654 posts
  • Joined: August 21

Posted 03 November 2023 - 17:37

What I think has happened in this particular model is Ricciardo's 2021/2022 outlier against Norris. Since Ricciardo's record prior to being paired with Norris was great, it has bumped Norris estimation disproportionately. Then it indirectly bumped Sainz through positive comparison with Norris and Hulkenberg through positive comparison with Sainz and Di Resta through comparison with Hulkenberg. And because Ricciardo has been beaten so badly by Norris, it has driven down Vettel's estimation and further indirectly all of Vettel's team mates as Raikkonen and Webber seem to be among the most underrated drivers here.


It would be interesting to see what would happen if you removed McLaren 2021-2022 battle from the equation.


This is the result if you remove that battle (but then you enter into the question of what other battles need to be removed - a big problem here is the lack of other teammate connections for Norris). It doesn't actually really make much difference apart from to Norris and Ricciardo.


1 Max Verstappen FASTEST

2 Charles Leclerc 0.164573

3 Lando Norris 0.198712

4 Daniel Ricciardo 0.210057

5 Carlos Sainz 0.227837

6 Nico Hulkenberg 0.318835

7 Fernando Alonso 0.37322

8 Nico Rosberg 0.430534

9 Lewis Hamilton 0.4727

10 George Russell 0.475953

11 Pierre Gasly 0.505902

12 Paul di Resta 0.512229

13 Valtteri Bottas 0.542381

14 Alexander Albon 0.559717

15 Sergio Perez 0.564011

16 Kamui Kobayashi 0.566436

17 Esteban Ocon 0.589972

18 Adrian Sutil 0.601652

19 Michael Schumacher 0.609771

20 Sebastian Vettel 0.619442

21 Daniil Kvyat 0.640059

22 Jean-Eric Vergne 0.652608

23 Felipe Massa 0.654603

24 Pascal Wehrlein 0.703968

25 Jenson Button 0.707356

26 Romain Grosjean 0.71341

27 Antonio Giovinazzi 0.758054

28 Esteban Gutierrez 0.762074

29 Kimi Raikkonen 0.80509

30 Kevin Magnussen 0.828338

31 Felipe Nasr 0.833745

32 Stoffel Vandoorne 0.850828

33 Marcus Ericsson 0.879672

34 Sergey Sirotkin 0.894182

35 Mark Webber 0.906357

36 Brendon Hartley 0.915902

37 Pastor Maldonado 0.919363

38 Mick Schumacher 0.958594

39 Zhou Guanyu 0.986381

40 Lance Stroll 1.017182

41 Yuki Tsunoda 1.153402

42 Jolyon Palmer 1.19963

43 Nicholas Latifi 1.248557

44 Robert Kubica 1.254953

45 Rio Haryanto 1.436904

46 Nikita Mazepin 1.520594

47 Bruno Senna 1.741732


Edited by F1Frog, 03 November 2023 - 17:39.


#31 eab

eab
  • Member

  • 1,028 posts
  • Joined: February 21

Posted 03 November 2023 - 23:05

I can't remember if the guy who had Christian Fittipaldi as the 11th best driver ever fell into the arrogant category or not but I hope he did.

The follow-up question now is, do you still remember whether that guy held up a board stating as Much? :)


Edited by eab, 03 November 2023 - 23:11.


#32 midgrid

midgrid
  • RC Forum Host

  • 10,171 posts
  • Joined: April 09

Posted 03 November 2023 - 23:30

I'll be very interested to see how the numbers change as you go back through time. In fact, you could even use how the numbers change through a driver's career to generate further data! :D

#33 eab

eab
  • Member

  • 1,028 posts
  • Joined: February 21

Posted 03 November 2023 - 23:35

If you don't adjust for anything then model output will closely match actual results (with all the other factors ignored)

'Closely match', so not 'a perfect match'.. What are things that would still differentiate one from the other according to you? Or did you use it as (the opposite of) in a manner of speaking?


#34 Boing Ball

Boing Ball
  • Member

  • 395 posts
  • Joined: July 00

Posted 04 November 2023 - 09:40


I have started making a very simple mathematical model to compare Formula 1 drivers. My model is based on comparing the outright pace of the Formula 1 drivers to their teammates, then comparing them all through drivers with shared teammates. So far, I have created a model for the drivers from 2012-2022.


Thank you for the effort. Just a remark: these comparisons were made already in 90s. The unit for comparing Schumacher and Häkkinen was called the "brundle".


#35 JimmyClark

JimmyClark
  • Member

  • 4,857 posts
  • Joined: July 20

Posted 04 November 2023 - 11:01

I remember being bored once and trying to come up with my own model. I got some interesting results that were in line with my thinking, and then wham out of nowhere Jean Alesi was calculated to be the best driver since 1990 haha.

So I closed my spreadsheet and gave up on that one.

#36 Ruudbackus

Ruudbackus
  • Member

  • 2,145 posts
  • Joined: October 18

Posted 04 November 2023 - 12:08

I remember being bored once and trying to come up with my own model. I got some interesting results that were in line with my thinking, and then wham out of nowhere Jean Alesi was calculated to be the best driver since 1990 haha.

So I closed my spreadsheet and gave up on that one.

/Sarcastic mode/ But isn't Jean the all time greatest? /end sarcastic mode/


#37 F1Frog

F1Frog
  • Member

  • 654 posts
  • Joined: August 21

Posted 10 November 2023 - 12:54

Here is another feature of the model. I have tried to estimate car performance, had every team had equal drivers. Here is the method.


For each driver in a given year, calculate their supertime result, and take away their overall score as this is the estimate for how good that driver is. Then I find the average for each driver in a team (the driver with the lower score is estimated to have done better than expected that year, and the one with the slightly higher score worse than expected), and this gives an estimate for the speed of the car that year. 


Notes:

1. This only applies to qualifying pace. Not race pace or reliability so cannot be directly compared to the constructors' standings.

2. This assumes each driver remains at the same level throughout their career. Or roughly, as they are at least averaged with their teammate who may be at a different level.

3. This uses the results for driver scores shown at the top of the page. If you don't like those results, you won't like these ones. If, as I think we all do, you consider Sebastian Vettel and Mark Webber to be much better than the results would suggest (at the moment), then the Red Bull of 2012 and 2013 will be considered faster than it actually was by the model. Similarly, the McLarens of 2019 and 2020 are almost certainly better than this model would suggest because Lando Norris in particular has probably been overrated. You can mentally adjust these results, as if you think Vettel should be 0.5% higher, for example, then the 2012 Red Bull should be 0.25% lower (or 0.5% lower if you also consider Webber to be 0.5% higher).

x

So the results, again, are not something I particularly agree with, but might become better once I add more seasons and include the effect of age and experience. But again, for the most simple version of the model, here are the estimates (only including teams with drivers on the list of 47):


2012:

1. Red Bull

2. McLaren (+0.070%)

3. Williams (+0.257%)

4. Lotus (+0.279%)

5. Ferrari (+0.679%)

6. Mercedes (+0.759%)

7. Sauber (+1.012%)

8. Force India (+1.114%)

9. Toro Rosso (+1.794%)


2013:

1. Red Bull

2. Mercedes (+0.330%)

3. Lotus (+0.477%)

4. Ferrari (+0.769%)

5. McLaren (+1.209%)

6. Force India (+1.413%)

7. Toro Rosso (+1.620%)

8. Sauber (+1.669%)

9. Williams (+1.962%)


2014:

1. Mercedes

2. Williams (+0.721%)

3. Red Bull (+0.990%)

4. McLaren (+1.061%)

5. Ferrari (+1.064%)

6. Toro Rosso (+1.646%)

7. Force India (+1.938%)

8. Sauber (+2.450%)

9. Lotus (+2.562%)

10. Caterham (+4.809%)


2015

1. Mercedes

2. Ferrari (+0.607%)

3. Williams (+1.056%)

4. Lotus (+1.535%)

5. Red Bull (+1.537%)

6. Force India (+1.939%)

7. Sauber (+2.210%)

8. Toro Rosso (+2.350%)

9. McLaren (+3.008%)


2016:

1. Mercedes

2. Ferrari (+0.517%)

3. Red Bull (+0.987%)

4. Williams (+1.491%)

5. Force India (+1.683%)

6. McLaren (+2.149%)

7. Haas (+2.176%)

8. Toro Rosso (+2.233%)

9. Renault (+2.584%)

10. Sauber (+3.096%)

11. Manor (+3.360%)


2017:

1. Ferrari

2. Mercedes (+0.058%)

3. Red Bull (+1.301%)

4. Force India (+2.041%)

5. Renault (+2.309%)

6. McLaren (+2.440%)

7. Williams (+2.442%)

8. Toro Rosso (+2.637%)

9. Haas  (+2.707%)

10. Sauber (+3.779%)


I will publish 2018-2022 later but don't have time to write them out right now.

7. 


#38 F1Frog

F1Frog
  • Member

  • 654 posts
  • Joined: August 21

Posted 10 November 2023 - 19:54

2018:

1. Ferrari

2. Mercedes (+0.161%)

3. Red Bull (+1.271%)

4. Haas (+1.832%)

5. Force India (+2.159%)

6. Renault (+2.415%)

7. Toro Rosso (+2.748%)

8. Sauber (+2.790%)

9. McLaren (+2.923%)

10. Williams (+3.148%)


2019:

1. Mercedes

2. Ferrari (+0.312%)

3. Red Bull (+1.005%)

4. Haas (+1.717%)

5. Alfa Romeo (+1.840%)

6. McLaren (+1.929%)

7. Renault (+1.980%)

8. Toro Rosso (+1.999%)

9. Racing Point (+2.077%)

10. Williams (+4.008%)


2020:

1. Mercedes

2. Racing Point (+0.953%)

3. Red Bull (+1.083%)

4. Alpha Tauri (+1.556%)

5. Ferrari (+1.689%)

6. Renault (+1.695%)

7. McLaren (+1.805%)

8. Alfa Romeo (+2.551%)

9. Williams (+2.560%)

10. Haas (+2.737%)


2021:

1. Mercedes

2. Red Bull (+0.447%)

3. Alpha Tauri (+0.733%)

4. Ferrari (+0.961%)

5. McLaren (+1.170%)

6. Aston Martin (+1.175%)

7. Alpine (+1.256%)

8. Alfa Romeo (+1.538%)

9. Williams (+1.629%)

10. Haas (+2.434%)


2022:

1. Ferrari

2. Red Bull (+0.098%)

3. Mercedes (+0.501%)

4. Alpine (+1.014%)

5. Alpha Tauri (+1.216%)

6. Alfa Romeo (+1.279%)

7. Haas (+1.302%)

8. Aston Martin (+1.437%)

9. McLaren (+1.502%)

10. Williams (+2.004%)


#39 Londoner

Londoner
  • Member

  • 225 posts
  • Joined: December 21

Posted 12 November 2023 - 09:03

Someone attempted to replicate the chess Elo score and apply it to F1 drivers here:

https://youtu.be/U16...iavigQXCBThEoOp

The model is not perfect, but unsurprisingly FA is on top with Fangio second. Verstappen in good position to challenge that top spot in a couple of years.

In my opinion, the model penalises a bit to much drivers that extended their career at a lower level (MS, SV) or which were out of form several of the seasons they competed (LH), but it’s still a good reference point

Edited by Londoner, 12 November 2023 - 09:05.


Advertisement

#40 FTB

FTB
  • Member

  • 659 posts
  • Joined: September 20

Posted 12 November 2023 - 10:10

Matches my assumptions that 2012 Williams was underrated, although not to the level of 3rd fastest quali car.


Edited by FTB, 12 November 2023 - 10:11.


#41 NewMrMe

NewMrMe
  • Member

  • 880 posts
  • Joined: August 12

Posted 12 November 2023 - 12:21

In my opinion, the model penalises a bit to much drivers that extended their career at a lower level (MS, SV) or which were out of form several of the seasons they competed (LH), but it’s still a good reference point


I am wondering if the right way to rank drivers is by whatever their peak rating is at any point in their career, not their overall ranking. This would eliminate the problem of drivers who stick around for several seasons beyond their peak dragging their whole record down. It also resolves the opposite scenario (which hasn't been mentioned yet), which is that drivers who's career are ended in their prime (either by accident or doing a Nico Rosberg) will be slightly overrated as the rating model has no record of them going into decline.


One ranking system I find interesting is Microsoft's Trueskill because that has two values for a player's rating. What it thinks the skill level is most likely to be and a confidence range where they believe the skill level sits within. It would be interesting who would have the highest rating and which other drivers could possibly be higher once you factor in the confidence range.


Edited by NewMrMe, 12 November 2023 - 12:21.


#42 Ferrim

Ferrim
  • Member

  • 1,391 posts
  • Joined: October 07

Posted 12 November 2023 - 13:50

Matches my assumptions that 2012 Williams was underrated, although not to the level of 3rd fastest quali car.


Alonso driving the 2012 Williams or the 2012 Lotus has always been an interesting "what if". If only to verify how strong they were compared to the Ferrari he almost drove to the title.

#43 jjcale

jjcale
  • Member

  • 16,192 posts
  • Joined: October 09

Posted 12 November 2023 - 14:12

I can barely do arithmetic ....and so some might say I am not qualified to comment on the OP's work ... but what do they know?


I will simply say that no matter how logical and diligent the OP has tried to be ... the fact that he has failed to align perfectly with my own subjective view (or even closely approximate) ... means I have only one thing to say:


Nice Try Buddy!


 ;)


#44 krea

krea
  • Member

  • 2,196 posts
  • Joined: October 11

Posted 12 November 2023 - 16:57

Just because you put numbers on things doesn't mean you can do math with them. 


#45 PlatenGlass

PlatenGlass
  • Member

  • 4,714 posts
  • Joined: June 14

Posted 12 November 2023 - 18:43

Someone attempted to replicate the chess Elo score and apply it to F1 drivers here:

https://youtu.be/U16...iavigQXCBThEoOp

The model is not perfect, but unsurprisingly FA is on top with Fangio second. Verstappen in good position to challenge that top spot in a couple of years.

In my opinion, the model penalises a bit to much drivers that extended their career at a lower level (MS, SV) or which were out of form several of the seasons they competed (LH), but it’s still a good reference point


Thanks for the link. The method used in that video (which he acknowledged) along with F1Frog's and indeed other ones I've seen all go by team-mate comparisons. It would be a bit like if chess players only ever had one opponent each year. And given that driver performance can change somewhat over the number of years it would take to go against enough drivers to have any meaningful data, these methods are very limited. Obviously each one has a slightly different algorithm so produces slightly different results, some perhaps better than others, they all have this same flaw and so a ceiling of how good they can be.


So basically it's been done now. The world doesn't need another all-time greatness list based purely on team-mate head-to-heads!


#46 F1Frog

F1Frog
  • Member

  • 654 posts
  • Joined: August 21

Posted 16 November 2023 - 14:41

These are the new results having added the 2009-2011 seasons:


1. Lando Norris FASTEST

2. Max Verstappen +0.029%

3. Charles Leclerc +0.142%

4. Fernando Alonso +0.243%

5. Carlos Sainz +0.248%

6. George Russell +0.308%

7. Daniel Ricciardo +0.328%

8. Nico Rosberg +0.336%

9. Lewis Hamilton +0.378%

10. Nico Hulkenberg +0.390%

11. Pierre Gasly +0.392%

12. Rubens Barrichello +0.432%

13. Valtteri Bottas +0.448%

14. Pascal Wehrlein +0.511%

15. Adrian Sutil +0.511%

16. Paul di Resta +0.543%

17. Sebastian Vettel +0.549%

18. Sergio Perez +0.594%

19. Antonio Giovinazzi +0.596%

20. Esteban Ocon +0.600%

21. Felipe Massa +0.608%

22. Jenson Button +0.614%

23. Romain Grosjean +0.638%

24. Alexander Albon +0.640%

25. Michael Schumacher +0.644%

26. Kimi Raikkonen +0.645%

27. Daniil Kvyat +0.656%

28. Pastor Maldonado +0.686%

29. Stoffel Vandoorne +0.720%

30. Esteban Gutierrez +0.731%

31. Jean-Eric Vergne +0.737%

32. Kazuki Nakajima +0.740%

33. Heikki Kovalainen +0.741%

34. Kevin Magnussen +0.763%

35. Kamui Kobayashi +0.795%

36. Brendon Hartley +0.802%

37. Pedro de la Rosa +0.823%

38. Felipe Nasr +0.838%

39. Jarno Trulli +0.845%

40. Mark Webber +0.847%

41. Robert Kubica +0.847%

42. Sergey Sirotkin +0.866%

43. Marcus Ericsson +0.884%

44. Zhou Guanyu +0.892%

45. Mick Schumacher +0.893%

46. Vitantonio Liuzzi +0.916%

47. Giancarlo Fisichella +0.933%

48. Rio Haryanto +0.943%

49. Timo Glock +0.989%

50. Lance Stroll +0.989%

51. Nelson Piquet Jr +1.018%

52. Yuki Tsunoda +1.039%

53. Nicholas Latifi +1.163%

54. Vitaly Petrov +1.186%

55. Nick Heidfeld +1.191%

56. Jolyon Palmer +1.203%

57. Charles Pic +1.261%

58. Bruno Senna +1.299%

59. Narain Karthikeyan +1.375%

60. Jerome d'Ambrosio +1.408%

61. Nikita Mazepin +1.455%

62. Lucas di Grassi +1.616%

63. Sakon Yamamoto +1.752%

64. Giedo van der Garde +1.830%

65. Karun Chandhok +1.963%


Some notes:

George Russell's ranking has been elevated by the fact that Robert Kubica's good years are starting to be included, and so his destruction of Kubica in 2019 actually makes a difference now. This is one comparison that arguably shouldn't be included, but for now I will leave it as I want the model to be totally objective, and hopefully I will be able to limit the effect of this season once I improve the model to include age and experience effects.


There was also one of those weird triangle situations in 2009-2011. Vitaly Petrov quite considerably outpaced Nick Heidfeld in 2011 (for outright pace), and Robert Kubica did likewise to Vitaly Petrov in 2010, in fact to an even greater extent. But at BMW in 2009, Nick Heidfeld actually outpaced Kubica by a very, very narrow margin. The 2011 comparison was, I think, quite unrepresentative of Heidfeld in general and so his ranking is particularly low for now but will improve once more of his career is included. Although Webber is also underrated by the model at the moment so the 2005 season won't help that too much.


Effectively, all of this group are rated too low, and Bruno Senna's woeful 2012 season does nothing to help that. That in turn brings down Kovalainen's score as he didn't destroy Petrov as much as one might expect, although his ranking recovers slightly due to 2009 alongside Hamilton. That means Trulli's score is very low as well, as is Glock's, and so Glock's three rookie teammates of 2010-2012 rank particularly low. All of this group will move up with more seasons. I would be surprised if Trulli and Kovalainen make the top ten like in the AWS model which is similar, I think.


In 2011, Liuzzi was quite close to Ricciardo, as Ricciardo was a rookie who started mid-season. That meant that when Sutil so decisively outperformed Liuzzi in 2009-2010, his score briefly went way too high. But including his half-season alongside Fisichella in 2009 moves it back down as Fisichella was destroyed by Raikkonen at the end of the year (hopefully the first step towards Raikkonen, Vettel and Webber regaining a representative score). A second season with Fisichella in 2008 will bring Sutil down further, although Fisichella's best years were long before those represented in the model for now.


Rubens Barrichello effectively matched Pastor Maldonado in 2011, but he beat Nico Hulkenberg in 2012, so his score is estimated to be somewhere in the middle. He then only just beat Jenson Button in 2009, which is helping to bring Button's score up a bit, but looking at all the individual season comparisons is making me think that Button wasn't really top-line for outright speed.


Lewis Hamilton beat Button fairly comfortably in all their seasons together for outright speed, and that is finally allowing his score to go to a more representative position, although the season with Kovalainen didn't help for aforementioned reasons. Russell's high score also helps Hamilton, while I fear that Rosberg will be far too highly-rated once Schumacher's best years are included, having beaten him for three seasons. But Rosberg also overall beat Hamilton over their four years for outright speed. Fernando Alonso now having four seasons of destroying Felipe Massa has also allowed his score to go to a more representative place.


Karun Chandhok being right at the bottom is harsh because he had quite a lot of races in 2010 with so many problems when the HRT was new that he didn't get many laps in and ended up a long way off the pace. He seemed to actually be faster than Sakon Yamamoto. 


I also corrected a mistake in the model previously where I was just taking drivers' supertime for the season and comparing it to each other, and now have altered it so, in 2016 for example, Wehrlein has a score for his races against Haryanto, and a separate one for the races against Ocon. This made his ranking higher, and Haryanto's too, as he did better versus Ocon using this fairer system, than in the previous one.


#47 renzmann

renzmann
  • Member

  • 5,999 posts
  • Joined: February 19

Posted 16 November 2023 - 16:54

I've seen several models over the years and they are fun. This one's fun to analyze as well. Well done!


However, I don't think models are (and maybe can't be) sophisticated enough to aptly show what's going on. There's endless variables that aren't considered here, and a lot of them cannot be operationalized.


I don't want to sound rude, but I think the stuff we used to do in the media section is more reliable. Let subjective experts give a grade for each driver's performance and find the average grade for each driver. Do this year for year, and you can pretty much tell who was/is the fastest driver.


#48 DW46

DW46
  • Member

  • 1,861 posts
  • Joined: December 21

Posted 16 November 2023 - 17:32

These are the new results having added the 2009-2011 seasons:

1. Lando Norris FASTEST
2. Max Verstappen +0.029%
3. Charles Leclerc +0.142%
4. Fernando Alonso +0.243%
5. Carlos Sainz +0.248%
6. George Russell +0.308%
7. Daniel Ricciardo +0.328%
8. Nico Rosberg +0.336%
9. Lewis Hamilton +0.378%
10. Nico Hulkenberg +0.390%
11. Pierre Gasly +0.392%
12. Rubens Barrichello +0.432%
13. Valtteri Bottas +0.448%
14. Pascal Wehrlein +0.511%
15. Adrian Sutil +0.511%
16. Paul di Resta +0.543%
17. Sebastian Vettel +0.549%
18. Sergio Perez +0.594%
19. Antonio Giovinazzi +0.596%
20. Esteban Ocon +0.600%
21. Felipe Massa +0.608%
22. Jenson Button +0.614%
23. Romain Grosjean +0.638%
24. Alexander Albon +0.640%
25. Michael Schumacher +0.644%
26. Kimi Raikkonen +0.645%
27. Daniil Kvyat +0.656%
28. Pastor Maldonado +0.686%
29. Stoffel Vandoorne +0.720%
30. Esteban Gutierrez +0.731%
31. Jean-Eric Vergne +0.737%
32. Kazuki Nakajima +0.740%
33. Heikki Kovalainen +0.741%
34. Kevin Magnussen +0.763%
35. Kamui Kobayashi +0.795%
36. Brendon Hartley +0.802%
37. Pedro de la Rosa +0.823%
38. Felipe Nasr +0.838%
39. Jarno Trulli +0.845%
40. Mark Webber +0.847%
41. Robert Kubica +0.847%
42. Sergey Sirotkin +0.866%
43. Marcus Ericsson +0.884%
44. Zhou Guanyu +0.892%
45. Mick Schumacher +0.893%
46. Vitantonio Liuzzi +0.916%
47. Giancarlo Fisichella +0.933%
48. Rio Haryanto +0.943%
49. Timo Glock +0.989%
50. Lance Stroll +0.989%
51. Nelson Piquet Jr +1.018%
52. Yuki Tsunoda +1.039%
53. Nicholas Latifi +1.163%
54. Vitaly Petrov +1.186%
55. Nick Heidfeld +1.191%
56. Jolyon Palmer +1.203%
57. Charles Pic +1.261%
58. Bruno Senna +1.299%
59. Narain Karthikeyan +1.375%
60. Jerome d'Ambrosio +1.408%
61. Nikita Mazepin +1.455%
62. Lucas di Grassi +1.616%
63. Sakon Yamamoto +1.752%
64. Giedo van der Garde +1.830%
65. Karun Chandhok +1.963%

Some notes:
George Russell's ranking has been elevated by the fact that Robert Kubica's good years are starting to be included, and so his destruction of Kubica in 2019 actually makes a difference now. This is one comparison that arguably shouldn't be included, but for now I will leave it as I want the model to be totally objective, and hopefully I will be able to limit the effect of this season once I improve the model to include age and experience effects.

There was also one of those weird triangle situations in 2009-2011. Vitaly Petrov quite considerably outpaced Nick Heidfeld in 2011 (for outright pace), and Robert Kubica did likewise to Vitaly Petrov in 2010, in fact to an even greater extent. But at BMW in 2009, Nick Heidfeld actually outpaced Kubica by a very, very narrow margin. The 2011 comparison was, I think, quite unrepresentative of Heidfeld in general and so his ranking is particularly low for now but will improve once more of his career is included. Although Webber is also underrated by the model at the moment so the 2005 season won't help that too much.

Effectively, all of this group are rated too low, and Bruno Senna's woeful 2012 season does nothing to help that. That in turn brings down Kovalainen's score as he didn't destroy Petrov as much as one might expect, although his ranking recovers slightly due to 2009 alongside Hamilton. That means Trulli's score is very low as well, as is Glock's, and so Glock's three rookie teammates of 2010-2012 rank particularly low. All of this group will move up with more seasons. I would be surprised if Trulli and Kovalainen make the top ten like in the AWS model which is similar, I think.

In 2011, Liuzzi was quite close to Ricciardo, as Ricciardo was a rookie who started mid-season. That meant that when Sutil so decisively outperformed Liuzzi in 2009-2010, his score briefly went way too high. But including his half-season alongside Fisichella in 2009 moves it back down as Fisichella was destroyed by Raikkonen at the end of the year (hopefully the first step towards Raikkonen, Vettel and Webber regaining a representative score). A second season with Fisichella in 2008 will bring Sutil down further, although Fisichella's best years were long before those represented in the model for now.

Rubens Barrichello effectively matched Pastor Maldonado in 2011, but he beat Nico Hulkenberg in 2012, so his score is estimated to be somewhere in the middle. He then only just beat Jenson Button in 2009, which is helping to bring Button's score up a bit, but looking at all the individual season comparisons is making me think that Button wasn't really top-line for outright speed.

Lewis Hamilton beat Button fairly comfortably in all their seasons together for outright speed, and that is finally allowing his score to go to a more representative position, although the season with Kovalainen didn't help for aforementioned reasons. Russell's high score also helps Hamilton, while I fear that Rosberg will be far too highly-rated once Schumacher's best years are included, having beaten him for three seasons. But Rosberg also overall beat Hamilton over their four years for outright speed. Fernando Alonso now having four seasons of destroying Felipe Massa has also allowed his score to go to a more representative place.

Karun Chandhok being right at the bottom is harsh because he had quite a lot of races in 2010 with so many problems when the HRT was new that he didn't get many laps in and ended up a long way off the pace. He seemed to actually be faster than Sakon Yamamoto.

I also corrected a mistake in the model previously where I was just taking drivers' supertime for the season and comparing it to each other, and now have altered it so, in 2016 for example, Wehrlein has a score for his races against Haryanto, and a separate one for the races against Ocon. This made his ranking higher, and Haryanto's too, as he did better versus Ocon using this fairer system, than in the previous one.

Fascinating read. Cheers mate, loads of effort went into this and we appreciate you sharing buddy.

Edited by DW46, 16 November 2023 - 17:32.


#49 F1Frog

F1Frog
  • Member

  • 654 posts
  • Joined: August 21

Posted 16 November 2023 - 20:59

I've seen several models over the years and they are fun. This one's fun to analyze as well. Well done!


However, I don't think models are (and maybe can't be) sophisticated enough to aptly show what's going on. There's endless variables that aren't considered here, and a lot of them cannot be operationalized.


I don't want to sound rude, but I think the stuff we used to do in the media section is more reliable. Let subjective experts give a grade for each driver's performance and find the average grade for each driver. Do this year for year, and you can pretty much tell who was/is the fastest driver.

I agree that this model will never give a particularly accurate result, but as I said before, I think the main positive of it is that the formula is so simple that it is really easy to unpick why certain drivers have been overrated or underrated.


#50 F1Frog

F1Frog
  • Member

  • 654 posts
  • Joined: August 21

Posted 16 November 2023 - 20:59

Fascinating read. Cheers mate, loads of effort went into this and we appreciate you sharing buddy.

Thank you very much, I am glad you enjoyed reading it, as I enjoy making it.